12 Month Milestone Chart Presentation Slide Template

Product Description
Most project presentations fall apart not because the plan is weak. They fail because the timeline is impossible to read. Phases overlap, dates disappear into dense tables, and stakeholders leave with different pictures of what happens when. This Milestone Chart Template fixes that problem directly.
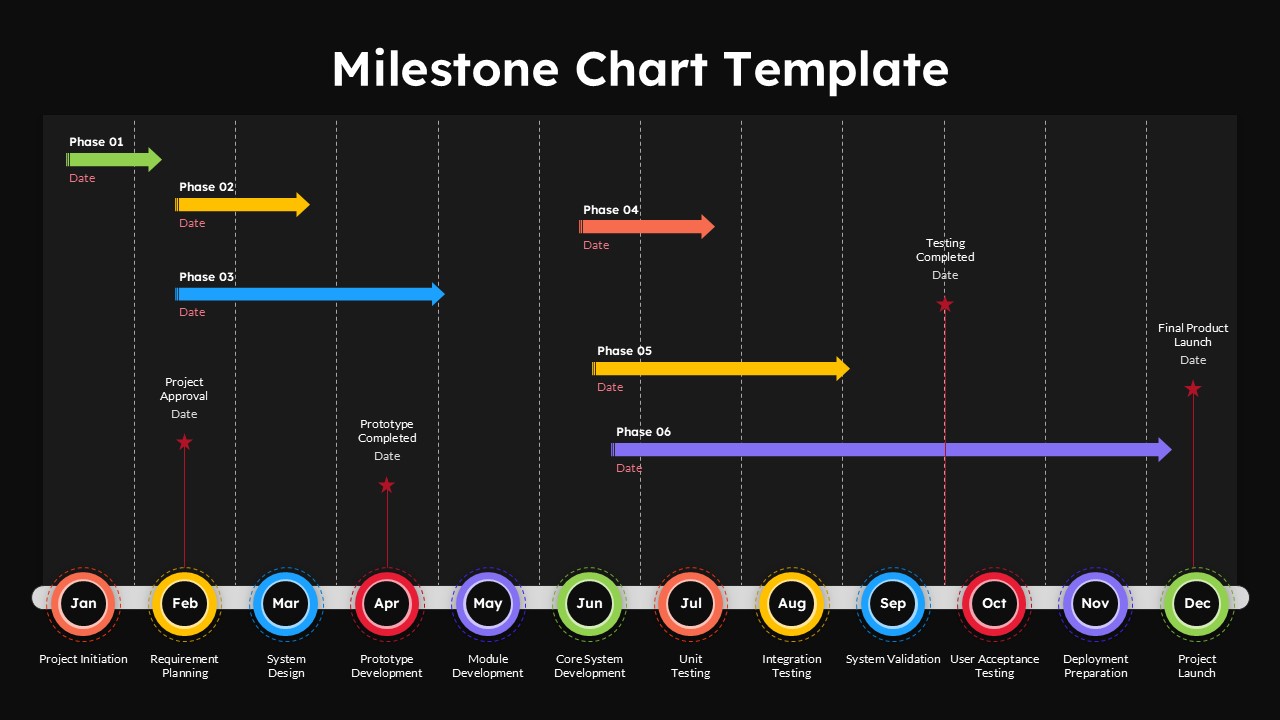
The slide maps a full twelve-month project from January through December. A horizontal timeline runs across the bottom with color-coded circular month markers as anchors. Six phase bars sit above the timeline in distinct colors. Green, yellow, blue, red, orange, and purple each represent a separate project phase. Every bar carries a phase label and date range so the audience reads the schedule without needing a verbal walkthrough.
Four red star markers sit at the most critical delivery points. Project Approval lands in February. Prototype Completed marks April. Testing Completed anchors October. Final Product Launch closes the slide in December. These four stars give any stakeholder an instant read on the shape of the entire project before they absorb the detail.
Twelve delivery labels run below the month markers across the full slide width. Project Initiation starts in January and the sequence moves through Requirement Planning, System Design, Prototype Development, Module Development, Core System Development, Unit Testing, Integration Testing, System Validation, User Acceptance Testing, Deployment Preparation, and Project Launch in December. This bottom row turns a phase chart into a complete project narrative. Stakeholders can read it independently without the presenter explaining each step.
The staggered phase layout keeps the slide clean even when multiple phases run in the same month. Vertical spacing between the arrow bars keeps every phase readable. This design detail separates a professional milestone roadmap template from anything built manually on a blank slide. For additional roadmap-style layouts, browse our timeline templates.
The template edits fully in both Microsoft PowerPoint and Google Slides. Your team can build it on desktop, collaborate in a browser, and present from any device without the phase bars shifting or the month markers losing alignment. Project managers, product owners, software leads, construction teams, marketing planners, and operations directors all use this slide in client reviews, board presentations, sprint planning sessions, and executive status updates.
Frequently Asked Questions
What is a milestone chart template and how does it differ from a regular timeline?
A milestone chart template combines phase tracking, date mapping, and critical delivery markers into one visual. A basic timeline only shows sequence, but a milestone chart also highlights the specific moments when something must be completed or approved. This template gives you both the phase overview and the milestone anchors in a single, presentation-ready slide.
What other use cases does this milestone chart slide support beyond software projects?
This template works well for construction planning, marketing campaign rollouts, product launch roadmaps, academic research schedules, event planning, manufacturing process tracking, and annual business planning. Any project with defined phases, fixed delivery dates, and parallel workstreams benefits from this kind of structured milestone overview.
Login to download this file
What do you think of this template?
-
Category:
Project Management -
-

-

Aspect Ratio: 16:9
-

Item ID: SPT0646
-

Designed by: Niranjana
-

Color
Related Templates
-

-
-

-

-

-

-

-

Agile Sprint Planning Timeline Presentation Template
Project Management
-
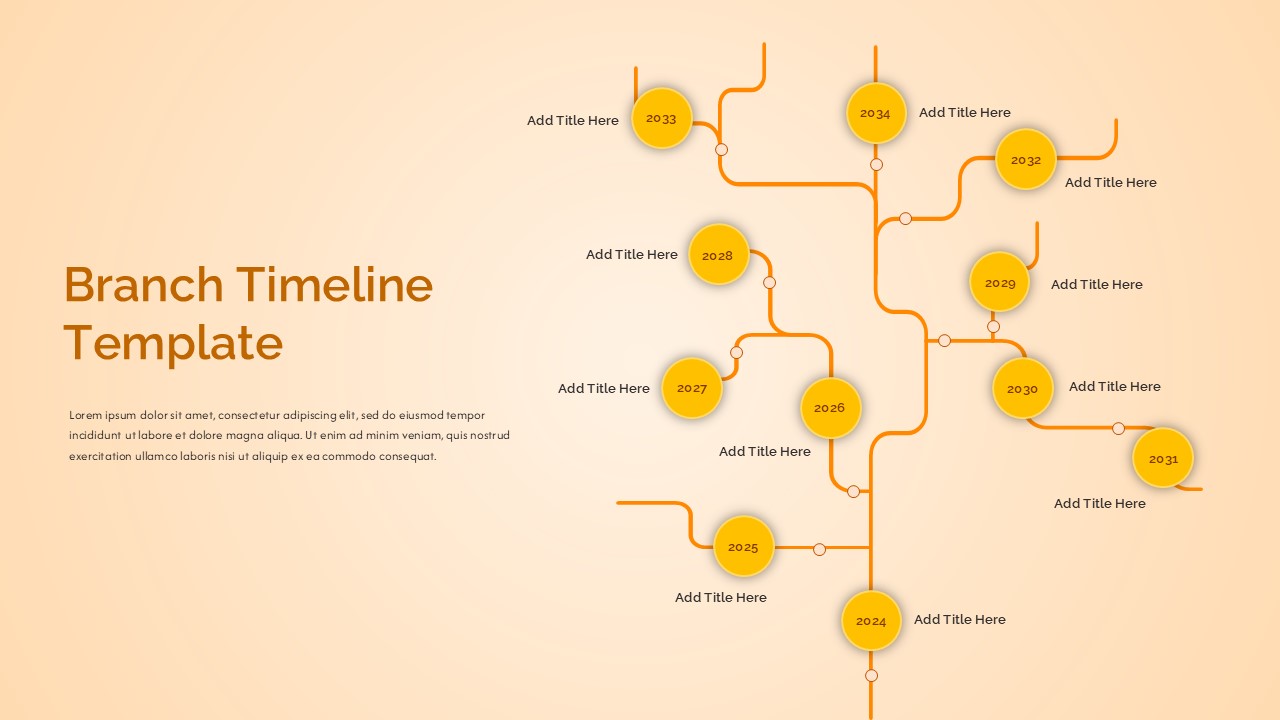
Branching Timeline Presentation Slide Template
Project Management
-

-
-


