Editable Charts & Graphs for PowerPoint
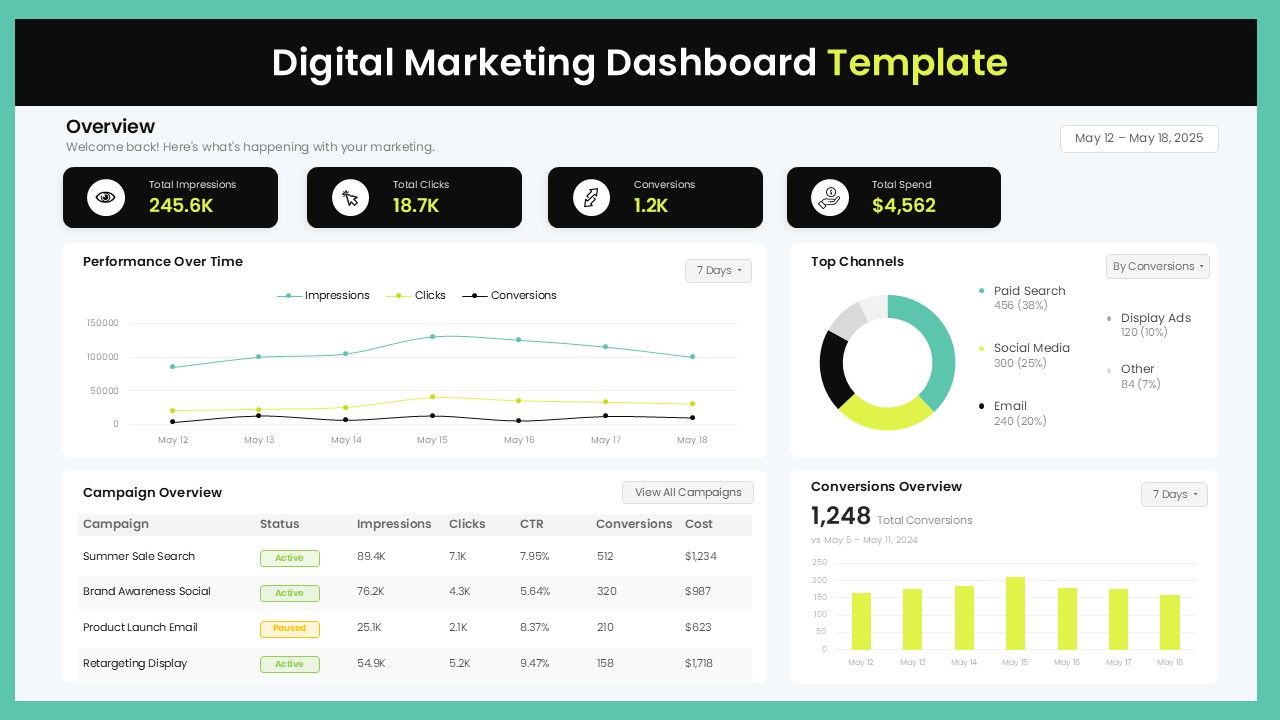
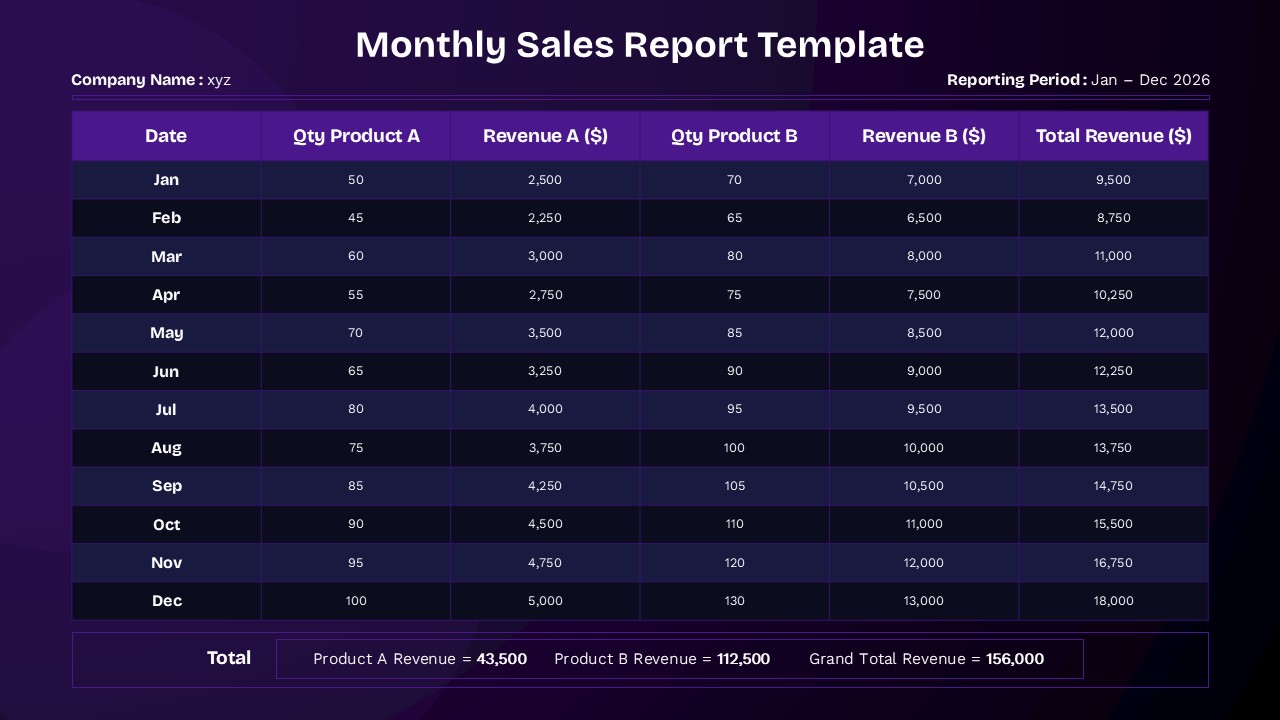
Download ready-to-use charts & graphs for PowerPoint from this curated collection built for analysts, consultants, business teams, and educators who need clear data visuals. Use these slides for KPI tracking, financial reports, market analysis, or performance reviews. Each template is fully editable in PowerPoint and Google Slides, so you can adjust values, labels, colors, and layouts to match your data. The collection includes bar charts, line graphs, pie charts, and comparison layouts. Browse the collection to find chart & graphs that fit your reporting needs.
Charts & Graphs
-
-
-
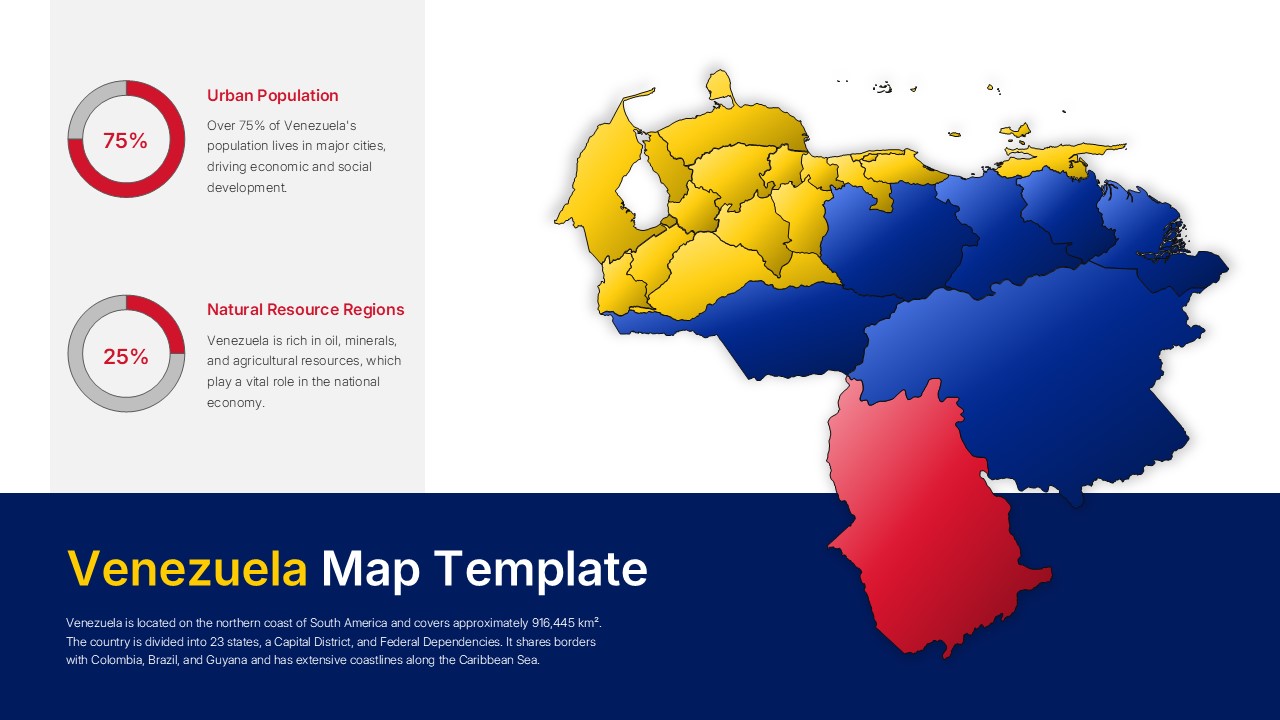
Venezuela Map PowerPoint Google Slides Template
Infographics
-
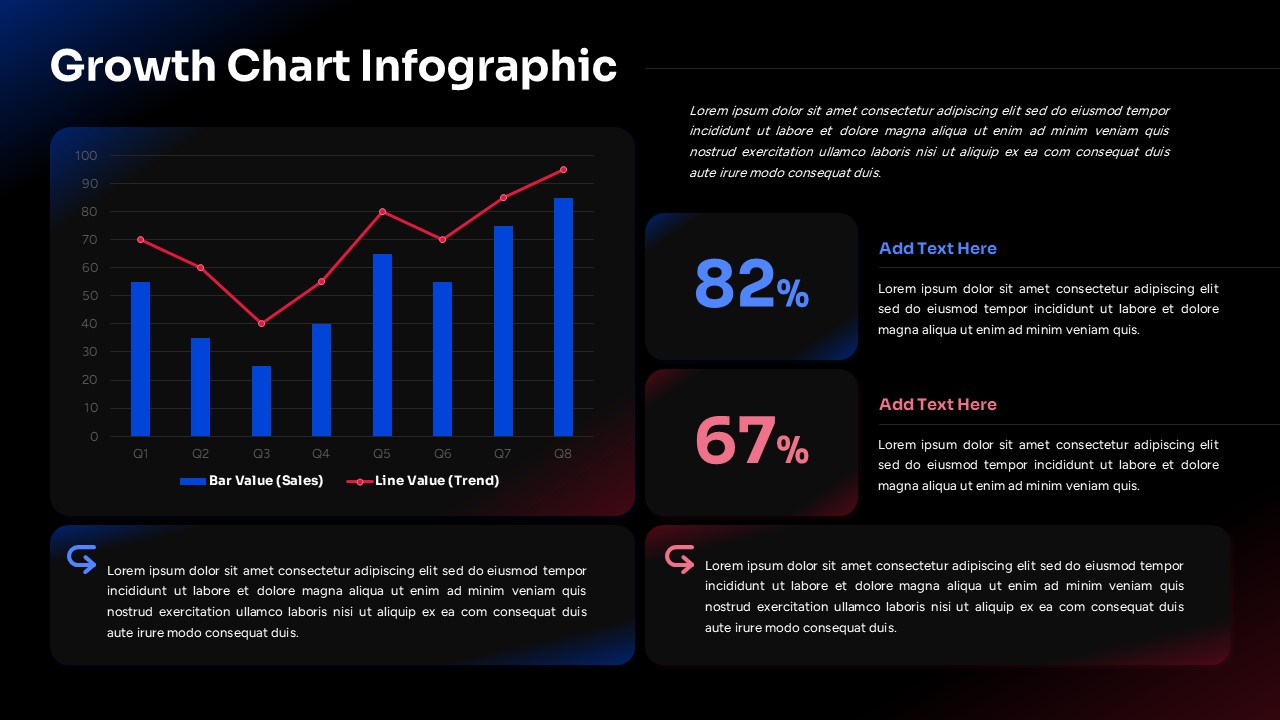
Growth Chart Infographic Template
Charts & Graphs
-
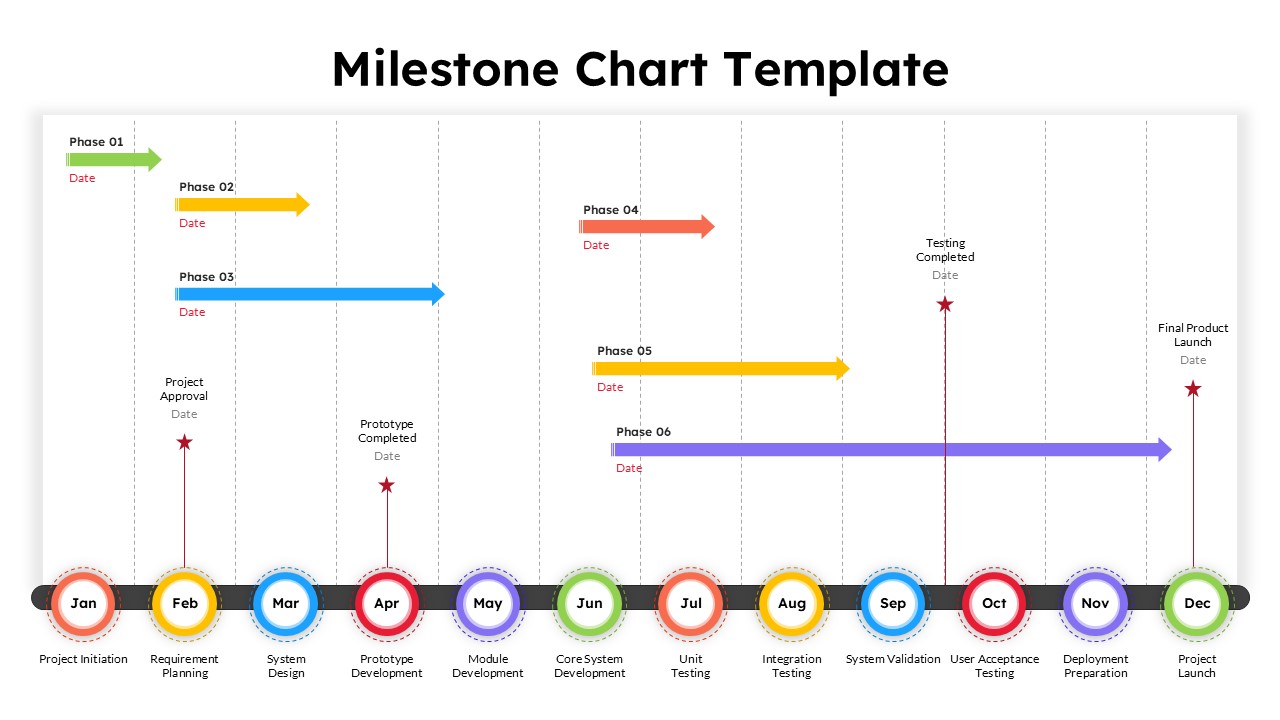
12 Month Milestone Chart Presentation Slide Template
Project Management
-
-
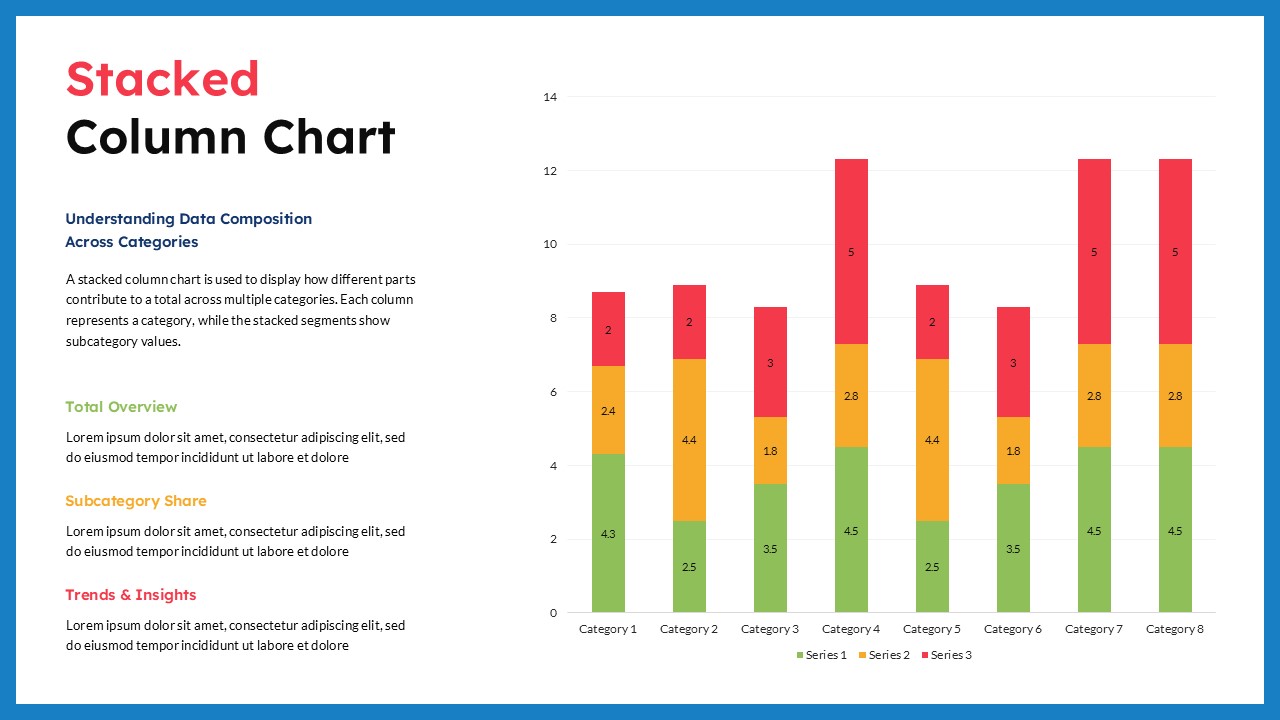
Stacked Column Chart PowerPoint Google Slides Template
Charts & Graphs
-
-

-

-


