Bottleneck Analysis Diagram Slide Template


Product Description
Every process has a weak point where work slows down, queues build up, and output falls short of what the system should deliver. This Bottleneck analysis diagram gives operations managers, process improvement consultants, lean practitioners, supply chain analysts, and project managers a visually structured, three-stage framework slide that turns a complex constraint identification exercise into a clear, presentation-ready analysis that any operational or leadership audience can follow and act on.
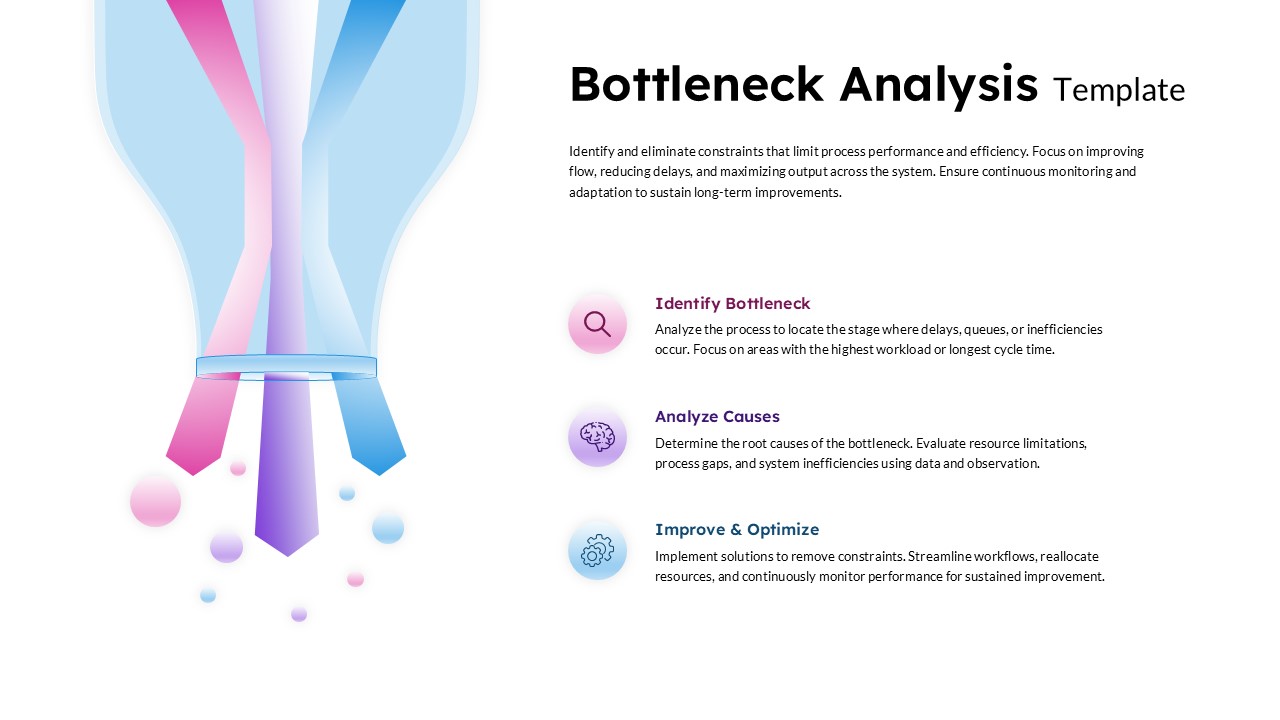
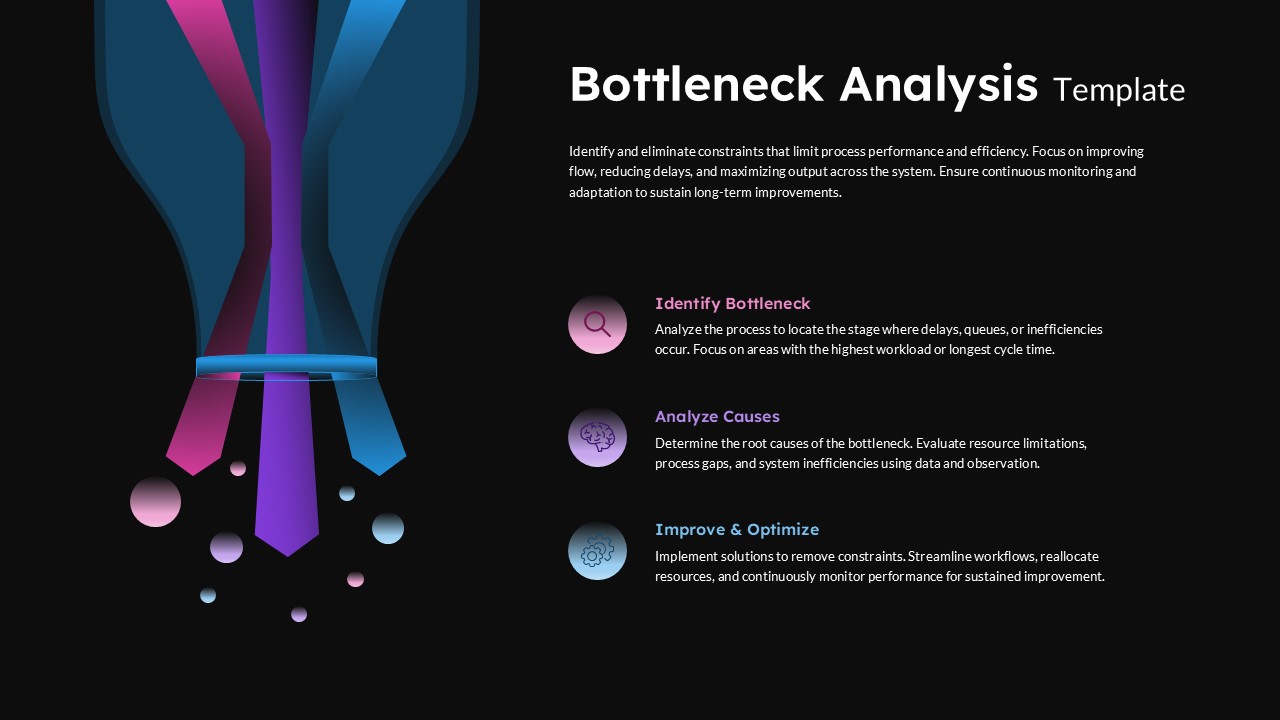
The slide pairs a striking three-stream funnel illustration on the left with a clean three-step annotation framework on the right. The funnel visual, rendered in gradient pink, purple, and blue with flowing streams converging at a narrow constriction point before dispersing downward, communicates the bottleneck concept visually before a single annotation is read. It is the kind of diagram that makes the problem feel tangible and the analysis feel grounded in operational reality rather than abstract theory.
- The Identify Bottleneck step frames the analysis starting point as locating the stage in a process where delays, queues, or inefficiencies occur, with a focus on areas carrying the highest workload or longest cycle time, giving teams a clear diagnostic entry point before root cause work begins.
- The Analyze Causes step moves the analysis deeper, covering root cause evaluation across resource limitations, process gaps, and system inefficiencies using data and direct observation, positioning the methodology as evidence-based rather than assumption-driven.
- The Improve and Optimize step closes the framework with actionable resolution guidance, covering constraint removal, workflow streamlining, resource reallocation, and ongoing performance monitoring to ensure improvements hold over time rather than reverting under operational pressure.
- The framing statement at the top right reinforces the strategic purpose of the entire framework: identify and eliminate constraints that limit process performance, improve flow, reduce delays, maximize output, and sustain long-term operational improvement through continuous monitoring and adaptation.
The clean white background with soft gradient illustration elements gives the slide a modern, professional aesthetic that works equally well in a lean Six Sigma workshop, an operations review board presentation, or a client-facing process consulting deliverable. This bottleneck analysis framework template is fully editable in both Microsoft PowerPoint and Google Slides, so operations teams, consultants, and process improvement leads can customize the step descriptions, update the framework labels, and present on whichever platform their organization or client environment uses without any loss of diagram quality or layout integrity.
Frequently Asked Questions
What is a Bottleneck Analysis Template?
A Bottleneck Analysis Template is a pre-designed presentation slide that structures the process of identifying, analyzing, and resolving operational constraints across three clear stages in a visually accessible format. It gives operations teams and consultants a ready-made framework for presenting constraint analysis findings to leadership, process owners, or improvement teams without building the visual structure from scratch.
Who should use this Bottleneck Analysis Template?
This template is built for operations managers, lean Six Sigma practitioners, supply chain analysts, process improvement consultants, manufacturing engineers, and project managers who need to present constraint identification and resolution frameworks to operational or executive audiences. It works across industries including manufacturing, logistics, healthcare, software development, financial services, and retail where process bottlenecks directly impact throughput, customer experience, and business performance.
Login to download this file
What do you think of this template?
-
Category:
Project -
-

-

Item ID: SPT0871
-

Designed by: Niranjana
-

Color
Related Templates
-

-

End to End Process Flow Diagram Template for PowerPoint & Google Slides
Project Management
-

-

Process Improvement PowerPoint & Google Slides Template
Business Strategy
-
-

Network Diagram Slide Template
Technology
-
-
-

SOAR Analysis Google Slides & PowerPoint Template
Business Strategy
-

-
-