Free Area Chart Data Visualization Presentation Template


Product Description
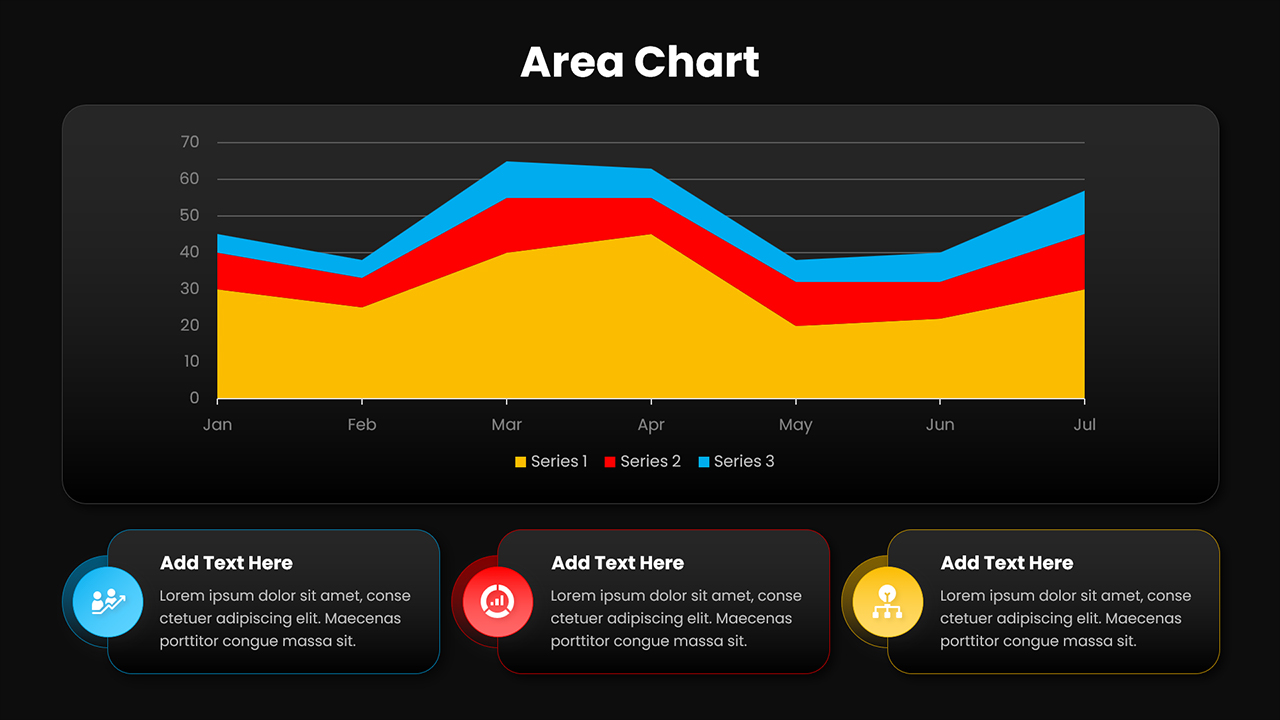
The Area Chart Data Visualization Template is a clean and professional slide designed to present trends and comparisons over time. It is fully editable in PowerPoint and Google Slides, making it easy to adapt for different presentations. The layout is simple to customize, so you can update data, colors, and text without extra effort. The multi-series area chart clearly shows how different data sets change and interact across months. The structured design helps your audience quickly understand key insights and patterns.
- Use it in business meetings to present performance trends and forecasts
- Add it to project updates to show progress and milestones over time
- Include it in reports to explain data in a clear and visual way
- Present marketing results such as campaign growth or engagement
- Share financial or operational data for better team discussions
Use this template to present your data clearly and make stronger decisions.
Login to download this file
What do you think of this template?
-
Category:
Charts & Graphs -
-

-

Aspect Ratio: 16:9
-

Item ID: SPT0044
-

Designed by: Krishnapriya
-

Color
Related Templates
-

-

Color Coded Pie Chart Data Visualization Presentation Template
Charts & Graphs
-

Pie Chart Infographic Data Visualization Presentation Template
Charts & Graphs
-

-

-

-

-

-

-

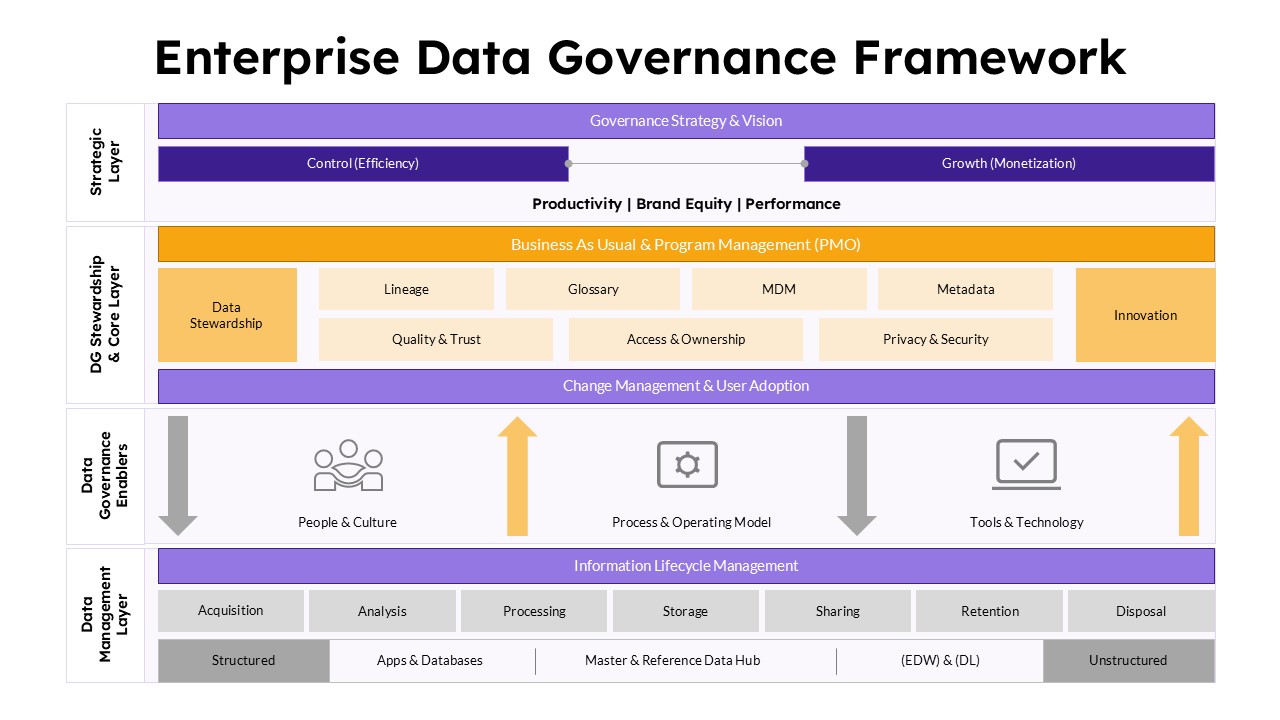
Data Governance Maturity Model Presentation Template
Business Strategy
-

Dual Comparison Bar Chart Data Analysis Slide Template
Charts & Graphs
-