
Area Chart Template for PowerPoint


Product Description
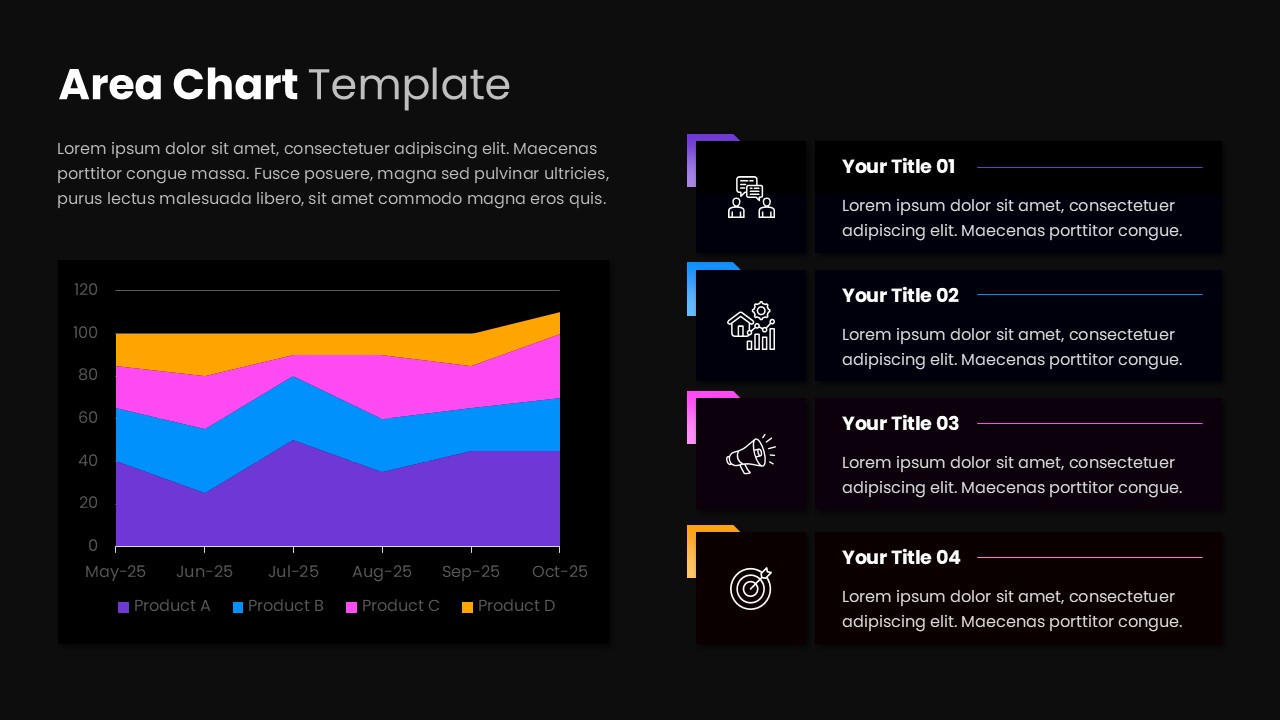
Present data-driven insights with this Area Chart Template for PowerPoint, designed to display fluctuations, category comparisons, and performance patterns in an easy-to-follow visual format. The slide combines a layered area graph with four supporting content panels, helping presenters connect numerical trends with the key points behind them. This PowerPoint template is suitable for:
- Tracking sales, revenue, or business growth over time
- Comparing the performance of multiple products or categories
- Reviewing financial and operational statistics
- Displaying marketing, customer, or market trends
- Supporting reports with visual data and key observations
Moreover, presenters can adapt this Area Chart Template to a variety of analytical and business presentation needs. The main chart uses multiple colored layers to represent separate data groups across a series of time periods, making variations and relationships easier to identify. Alongside the graph, four neatly arranged information cards provide room for explanations, findings, metrics, or business highlights. This Area Chart Template for PowerPoint uses a minimalist layout with bold headings, subtle visual accents, and clearly separated content areas to maintain readability. Each information card includes an editable icon, title, and description, allowing presenters to connect specific observations with the data shown in the chart.
Users can easily personalize the slide by changing chart values, category names, dates, text, colors, icons, typography, and other editable elements. Company branding, additional statistics, labels, or supporting notes can also be incorporated to suit different presentation purposes. Whether used in a sales report, business review, marketing analysis, or management presentation, this slide provides a practical way to turn numerical information into an understandable visual story. Download and customize the template to present data trends with clarity and a professional appearance.
Frequently Asked Questions
How can an Area Chart Template help with data presentations?
An Area Chart Template makes it easier to illustrate movement over time while showing how individual categories contribute to the overall data.
Login to download this file
What do you think of this template?
-
Category:
Charts & Graphs -
-

-

Aspect Ratio: 16:9
-

Item ID: SPT0046
-

Designed by: Krishnapriya
-

Color
Related Templates
-
-

-

Pie Chart Presentation Template for PowerPoint & Google Slides
Charts & Graphs
-

Simple Gantt Chart Planning Template for PowerPoint & Google Slides
Project Overview
-

Waterfall Chart PowerPoint & Google Slides Template
Charts & Graphs
-

-

PERT Chart PowerPoint & Google Slides Template
Project Management
-

-
Free Gantt Chart PowerPoint and Google Slides Template
Project Overview
-
-
-
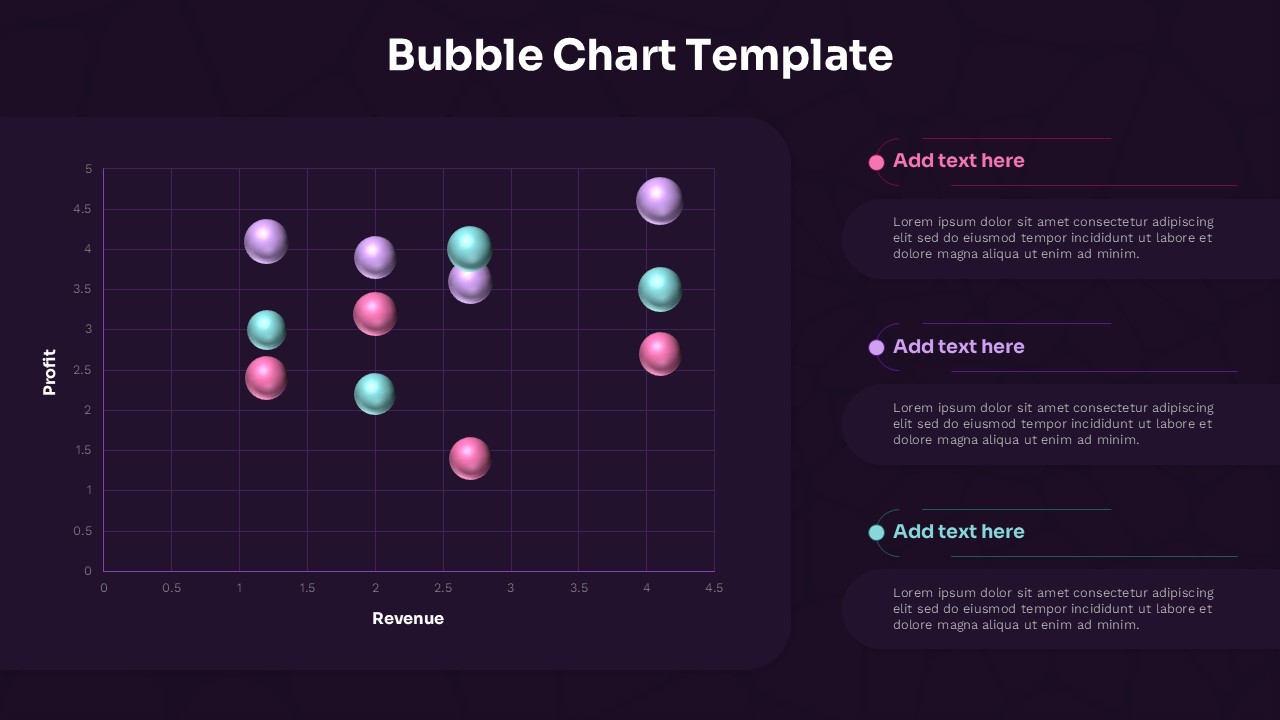
Bubble Chart PowerPoint Template
Business


