Dual Comparison Bar Chart Data Analysis Slide Template


Product Description
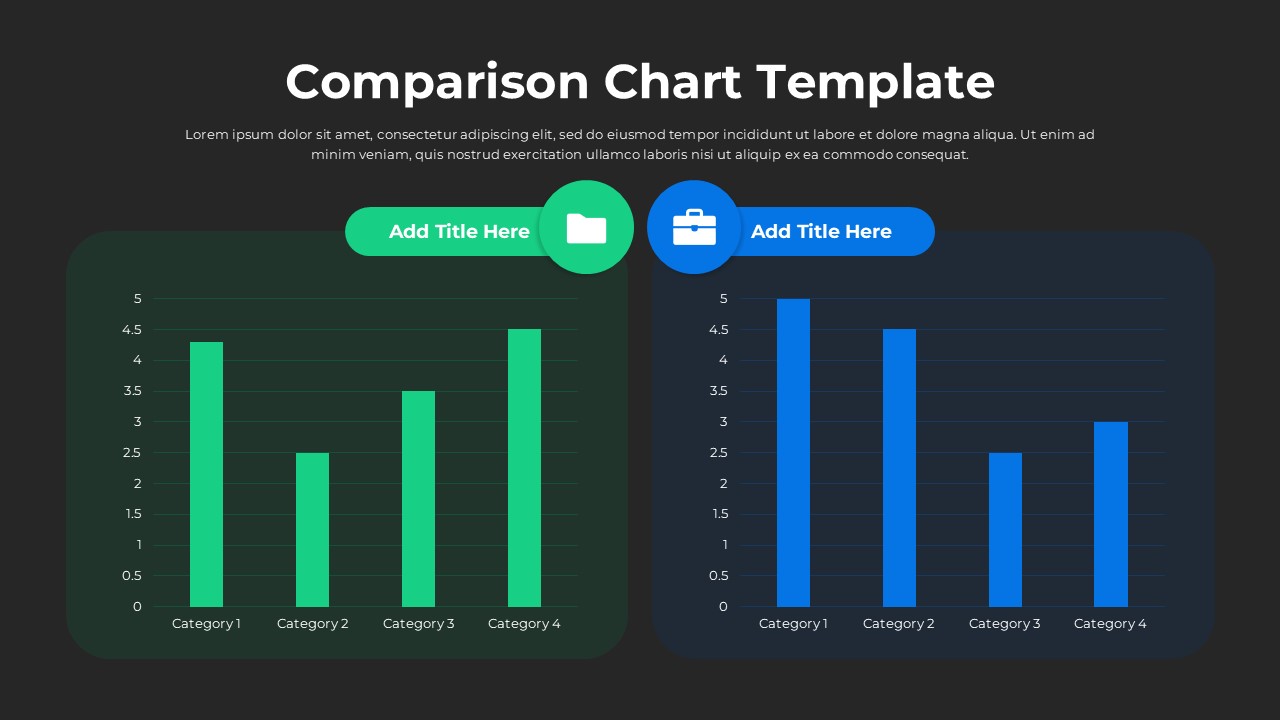
Deliver clear and compelling data comparisons with this Dual Comparison Chart Template, designed to present two datasets side by side in a visually structured format. This template is ideal for professionals who need to highlight differences, trends, or performance metrics across multiple categories while maintaining clarity and visual balance.
The slide features two distinct bar chart sections, each enclosed within softly rounded containers and labeled with customizable titles. The side-by-side arrangement allows your audience to instantly compare values across identical categories, making it easier to identify patterns, strengths, and gaps. Clean gridlines and evenly spaced bars ensure that the data remains readable and well-organized.
Each chart is complemented by simple icon-based headers, adding a subtle visual cue that enhances comprehension without distracting from the core data. The contrasting color schemes between the two sections help differentiate datasets while maintaining a cohesive and professional design language.
This template also includes both light and dark background variations, giving you flexibility to adapt your presentation to different settings or brand guidelines. Whether you’re presenting in a corporate meeting or a stakeholder review, the design ensures your data stands out clearly.
Fully compatible with PowerPoint and Google Slides, this template is easy to customize. You can update chart values, rename categories, and adjust colors to match your brand identity. It is suitable for a wide range of applications, including business reporting, marketing analysis, financial comparisons, and academic presentations.
With its clean layout and intuitive structure, this free template helps transform complex data into meaningful visual insights, enabling more informed decision-making.
Login to download this file
What do you think of this template?
-
Category:
Charts & Graphs -
-

-

Aspect Ratio: 16:9
-

Item ID: SPT0017
-

Designed by: Niranjana
-

Color
Related Templates
-

-

-

-

Column Chart Product Comparison 3D Presentation Template
Charts & Graphs
-
-

-

-

Free Column Chart Comparison Presentation Template
Charts & Graphs
-

-

-

Free Area Chart Data Visualization Presentation Template
Charts & Graphs
-


