Column Chart Product Comparison 3D Presentation Template


Product Description
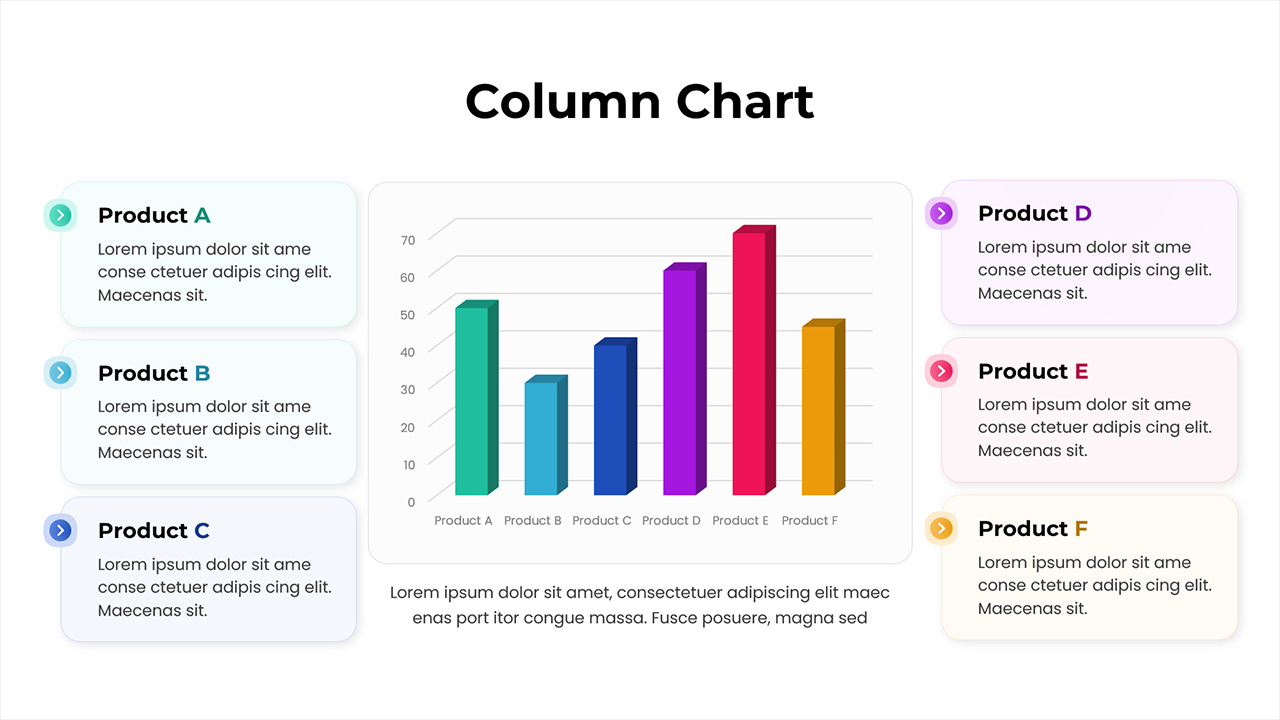
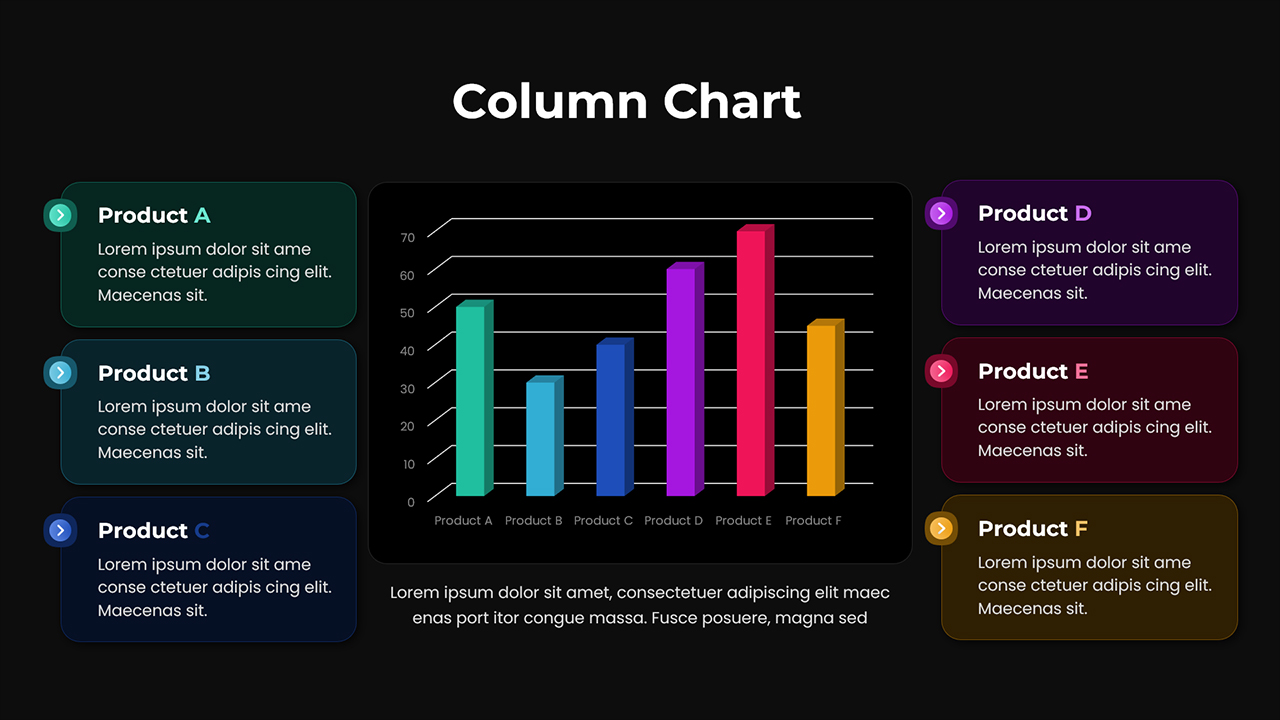
This professional Column Chart Product Comparison Template is a high performance visual tool designed for seamless integration into PowerPoint and Google Slides. Users can effortlessly modify every element, from the 3D bar heights to the vibrant color schemes, ensuring full customization for specific branding requirements. The layout is engineered to be fully editable, allowing for real-time data adjustments during strategy sessions or client pitches. By utilizing this pre-formatted slide, presenters can maintain a consistent aesthetic while focusing on high-level data analysis rather than manual design work.
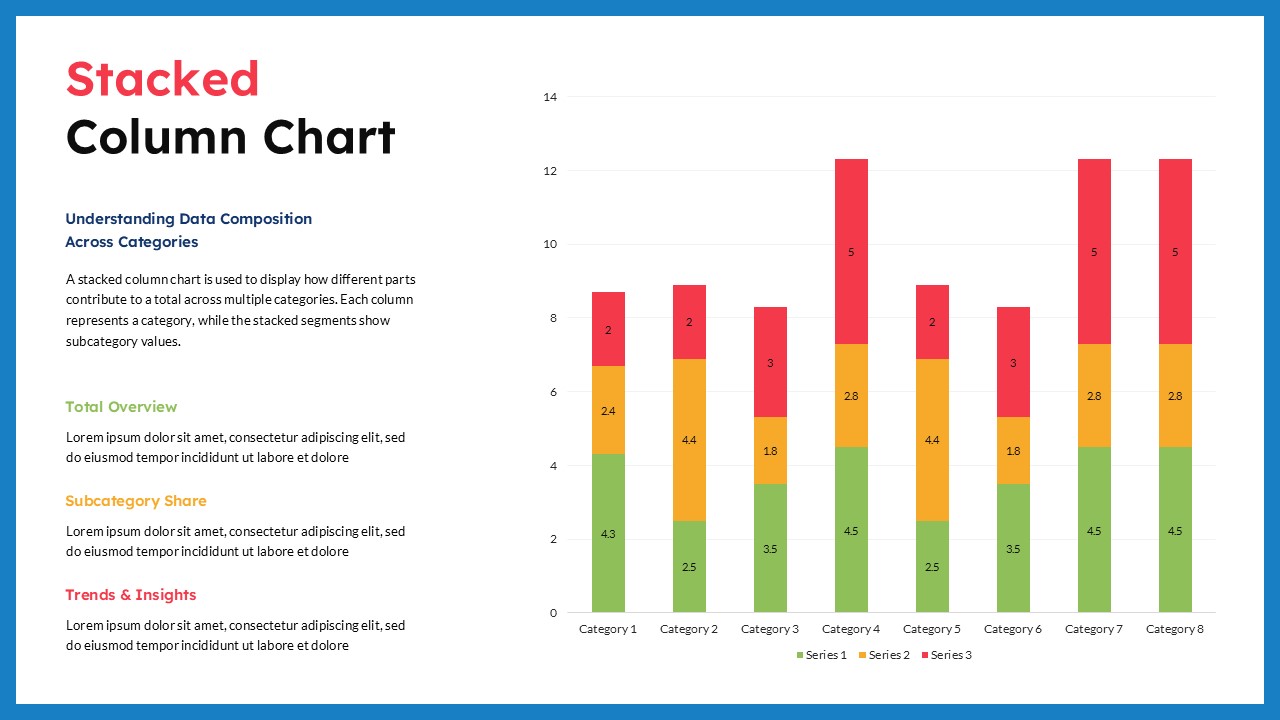
The template features a central 3D column chart flanked by six distinct information blocks, which significantly improves presentation flow by connecting quantitative data directly to qualitative descriptions. This symmetrical arrangement allows the audience to cross-reference numerical values with product-specific details without visual fatigue. The use of a clear Y-axis ranging from 0 to 70 provides a precise framework for measuring performance across Products A through F.
The content organization is further enhanced by the categorized side panels, which use color-coded icons to mirror the chart’s data points. This logical grouping minimizes cognitive load, making it easier for stakeholders to digest complex comparative sets. By framing the data within a clean, minimalist border, the template ensures that the primary focus remains on the analytical insights. This professional structure is ideal for quarterly reviews, market research summaries, or competitive landscape assessments where clarity is paramount. You can also complement your slides with other comparison templates to present broader analytical insights effectively.
Download this template today to transform your data into a compelling visual narrative.
Login to download this file
What do you think of this template?
-
Category:
Charts & Graphs -
-

-

Aspect Ratio: 16:9
-

Item ID: SPT0011
-

Designed by: Krishnapriya
-

Color
Related Templates
-

Free Column Chart Comparison Presentation Template
Charts & Graphs
-

-

Free Multi Column Comparison Presentation Template
Infographics
-
Stacked Column Chart PowerPoint Google Slides Template
Charts & Graphs
-

Free Clustered Column Chart Presentation Template
Charts & Graphs
-

Dual Comparison Bar Chart Data Analysis Slide Template
Charts & Graphs
-

-
-

-

Product Roadmap Google Slides & PowerPoint Template
Business Strategy
-

-


