BCG Matrix Presentation Template for Smarter Product Portfolio Decisions
Product Description
Every business has products that are growing fast, products that fund everything quietly, products that raise questions, and products that are probably past their prime. The hard part is not knowing which is which. It is presenting that analysis in a way that drives the right conversation in the right room. This BCG Matrix Template gives business strategists, product managers, marketing directors, MBA students, and management consultants a clean, professionally designed four-quadrant matrix that maps any product portfolio against market growth rate and relative market share with the visual precision that strategic decisions deserve.
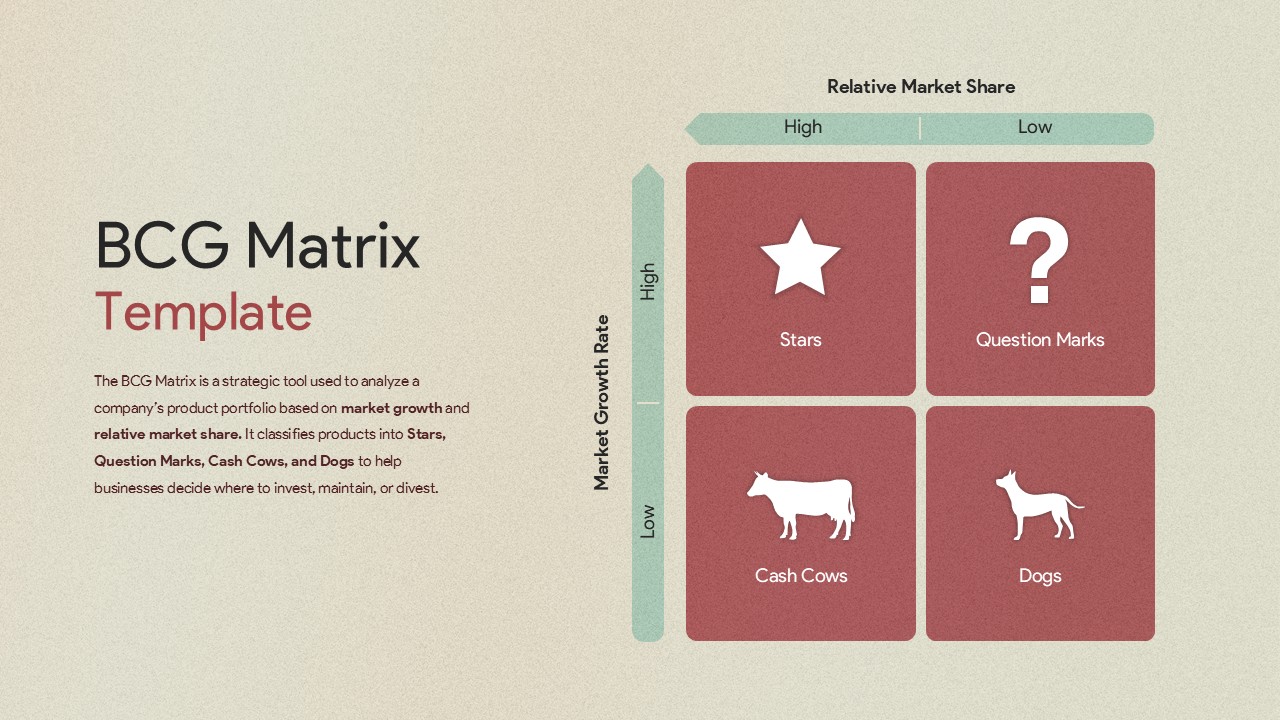
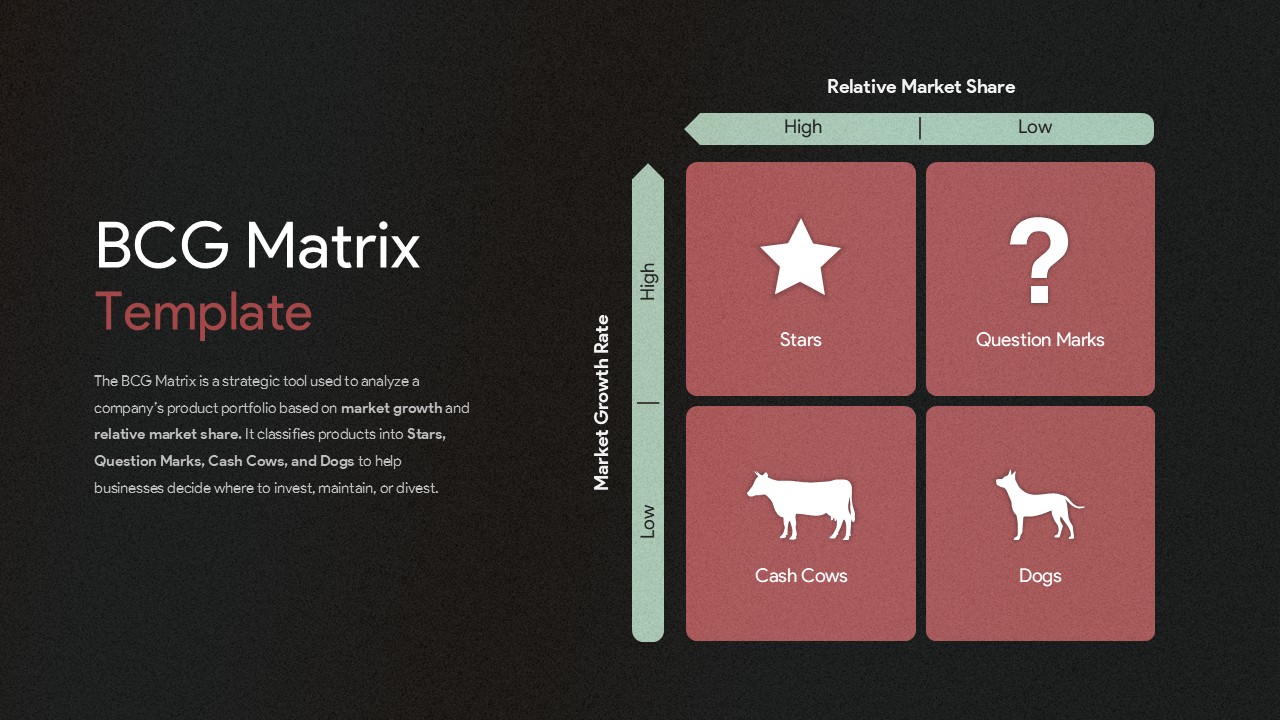
The slide is built around the classic two-by-two BCG growth share matrix rendered in a warm terracotta and sage palette on a textured cream background, giving it a premium, considered aesthetic that feels as at home in a boardroom strategy session as it does in a business school case study presentation. The four quadrants are clearly labeled with their iconic category names and illustrated with recognizable silhouette icons, making the framework immediately legible for both specialist and non-specialist audiences. This format also works well within broader business strategy presentation slides where portfolio priorities need to be communicated clearly.
- The Stars quadrant sits in the high market share, high growth rate position, representing the products worth doubling down on and the ones most leadership audiences want to talk about first.
- The Question Marks quadrant occupies the high growth, low market share position, capturing the products that demand a decision about whether to invest, pivot, or exit before the growth window closes.
- The Cash Cows quadrant holds the low growth, high market share products that fund everything else in the portfolio, a category that often gets underappreciated in strategy conversations until someone maps it visually.
- The Dogs quadrant sits at low growth and low market share, the products that consume resources without proportional return and that this kind of analysis gives leaders the evidence and framework to address.
The left panel carries a concise framework explanation covering market growth rate and relative market share as the two analytical axes, giving any audience unfamiliar with the BCG model enough context to follow the analysis without a separate explainer slide. This BCG Matrix presentation template is fully editable in both Microsoft PowerPoint and Google Slides, so strategy teams, consultants, and educators can replace the placeholder content with real portfolio data, adjust the quadrant positioning, and present confidently on whichever platform their organization or client uses.
Frequently Asked Questions
What is a BCG Matrix and how is it used in business strategy?
The BCG Matrix is a strategic portfolio analysis tool developed by the Boston Consulting Group that classifies a company's products or business units into four categories based on market growth rate and relative market share: Stars, Question Marks, Cash Cows, and Dogs. It helps leadership teams make informed decisions about where to invest, maintain, or divest across their product portfolio.
Who should use this BCG Matrix Template?
This template is built for product managers, marketing strategists, management consultants, corporate strategy teams, and MBA students who need to present portfolio analysis clearly to executive or client audiences. It works across industries including consumer goods, technology, retail, healthcare, and financial services where multi-product portfolio decisions drive resource allocation and business growth planning.
Login to download this file
What do you think of this template?
-
Category:
Business Strategy -
-

-

Aspect Ratio: 16:9
-

Item ID: SPT0663
-

Designed by: Athira
-

Color
Related Templates
-

-
-

Cost Benefit Analysis Matrix Google Slides & PowerPoint Template
Business Strategy
-

Grand Strategy Matrix Template For PowerPoint
Business Strategy
-

Column Chart Product Comparison 3D Presentation Template
Charts & Graphs
-

-

Product Roadmap Google Slides & PowerPoint Template
Business Strategy
-

-

-

-

-


