Area Chart Data Visualization Presentation Template for PowerPoint & Google Slides


Product Description
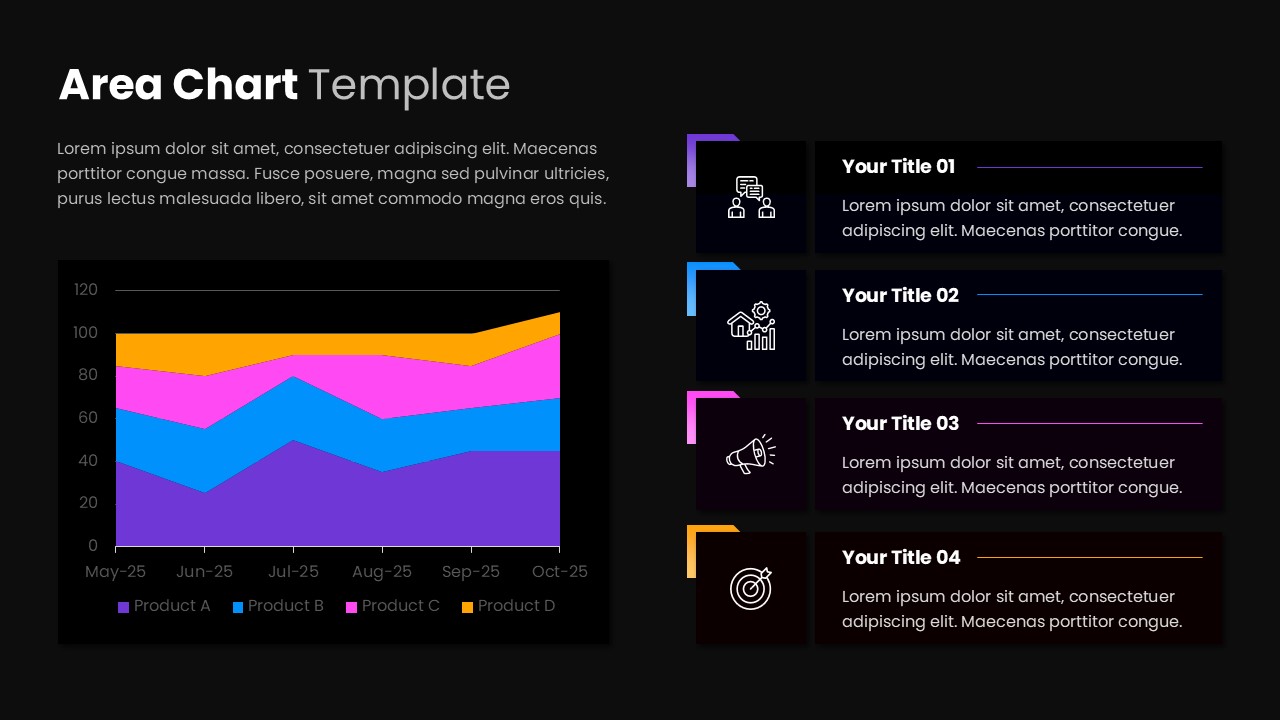
Multi-Series Area Chart Slide Template for Business Data Presentations
This area chart presentation template is fully editable in both PowerPoint and Google Slides, making it easy to customize for any reporting or business need. You can update chart data, adjust color schemes, and replace labels in just a few clicks. It is designed for professionals who want to present trends and comparisons clearly without spending hours on design. The clean layout works straight out of the box and fits any brand identity.
The template helps turn complex data into a clear visual story your audience can follow. With layered area chart sections, it shows growth patterns and segment comparisons at a glance. Supporting content areas let you add key takeaways and short explanations right next to the chart, so your audience gets context along with the data. It is ideal for meetings, stakeholder reports, and strategic reviews.
Key Features:
- Multi-series area chart layout for comparing multiple data categories over time
- Dedicated content sections for insights, analysis, and key takeaways
- Icon-paired visual elements that guide the audience through each point
- Compatible with PowerPoint and Google Slides for flexible use
- Easy to edit chart values, axis labels, and color themes
- Professional and clean design that keeps focus on the data
- Suitable for business analysts, marketers, project managers, and executives
Download this template today and start presenting your data with clarity and confidence.
Login to download this file
What do you think of this template?
-
Category:
Charts & Graphs -
-

-

Aspect Ratio: 16:9
-

Item ID: SPT0046
-

Designed by: Krishnapriya
-

Color
Related Templates
-

-

-

Color Coded Pie Chart Data Visualization Presentation Template
Charts & Graphs
-

Pie Chart Infographic Data Visualization Presentation Template
Charts & Graphs
-

Free Area Chart Data Visualization Presentation Template
Charts & Graphs
-

-

-

-

Dual Comparison Bar Chart Data Analysis Slide Template
Charts & Graphs
-

-

-

Data Strategy Roadmap Template for PowerPoint & Google Slides
Project Management


