Growth Chart Infographic Template
Product Description
Numbers tell a story, but only when the visual design gives them the right stage. This Growth Chart Infographic Template was built for business analysts, sales leaders, marketing managers, finance teams, and startup founders who need to present performance data in a way that is both analytically credible and visually compelling in front of an executive or investor audience.
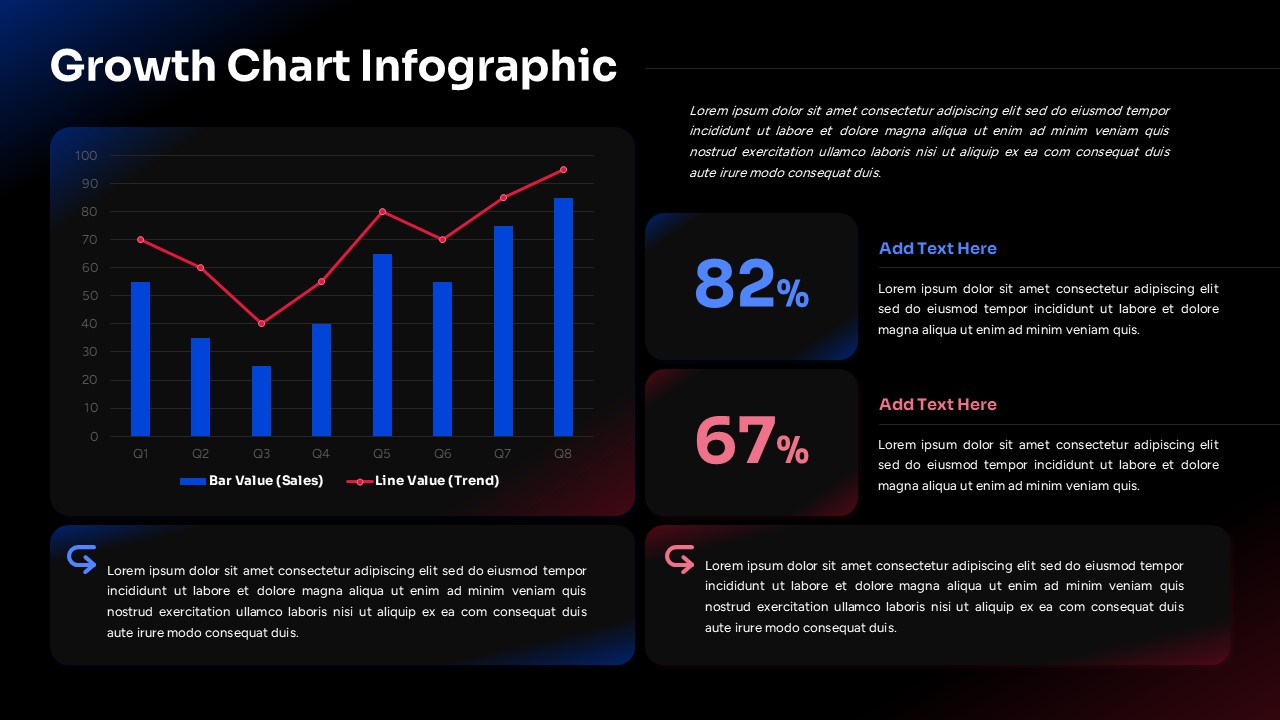
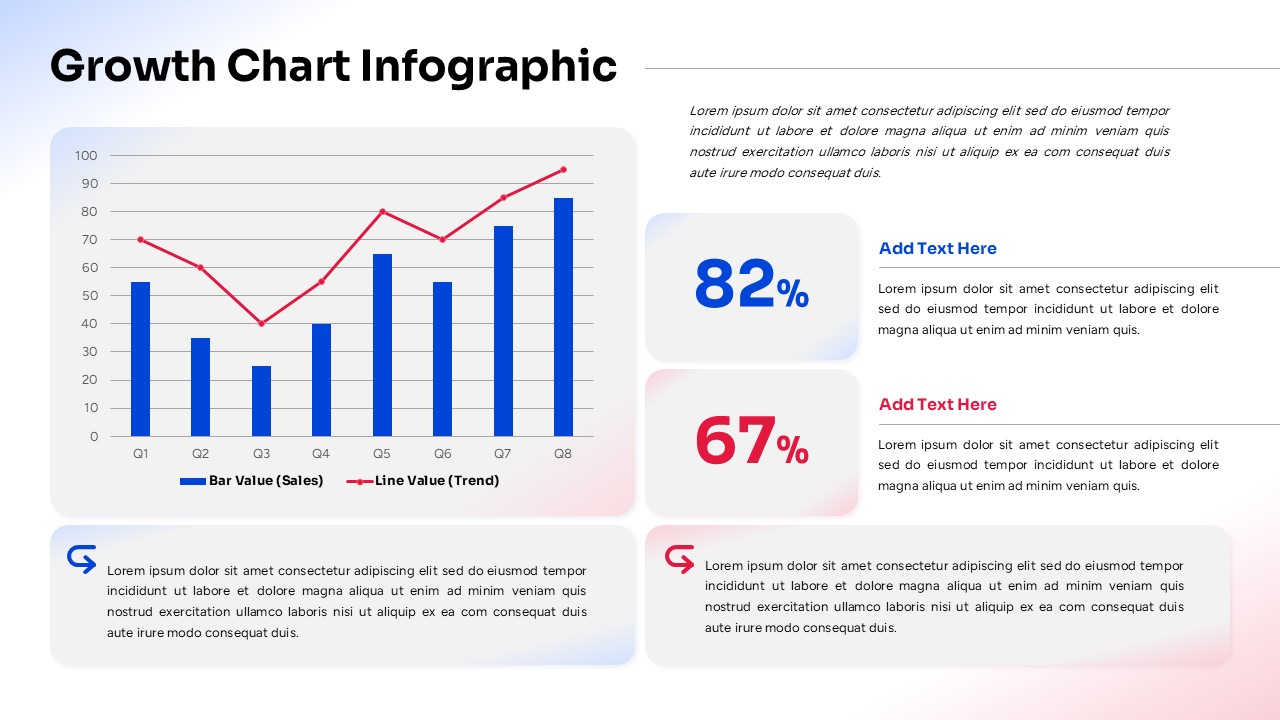
The slide is structured around a dual-axis combo chart on the left that tracks eight quarters of data simultaneously using blue bar columns for Sales volume and a red trend line for performance trajectory. This combination is particularly powerful for quarterly business reviews and investor updates because it lets audiences see both absolute values and directional momentum in a single glance without switching between slides.
- The KPI highlight cards on the right display two key percentage metrics at large scale, 82% and 67%, each paired with a labeled text block for context, giving presenters a clean way to spotlight the numbers that matter most without burying them in the chart.
- Two insight text panels at the bottom of the slide create space for narrative commentary, analysis, or key takeaways, turning a data slide into a complete storytelling unit that does not require a separate notes slide to make sense.
- The deep dark background with blue and red data elements gives the whole slide a dashboard-grade aesthetic that reads as authoritative and data-driven, ideal for boardroom settings, investor briefings, and performance review presentations where first impressions matter.
This growth chart infographic template is fully editable in both Microsoft PowerPoint and Google Slides, so your team can plug in real data, update the KPI figures, and adjust the commentary panels without rebuilding the layout from scratch. Whether you are presenting quarterly sales results, tracking marketing campaign performance, reporting on operational efficiency gains, or visualizing business growth for a board meeting, this template gives your data the visual treatment it deserves.
Frequently Asked Questions
What is a Growth Chart Infographic Template?
A Growth Chart Infographic Template is a pre-designed presentation slide that combines chart visuals, KPI callouts, and narrative text panels into a single cohesive layout for presenting business performance data. It removes the need to build data slides from scratch and ensures your numbers are presented with the visual clarity and professional structure that high-stakes audiences expect.
Who should use this Growth Chart Infographic Template?
This template is designed for sales managers, business analysts, marketing leads, finance directors, startup founders, and consultants who regularly present data-driven performance updates to leadership, investors, or clients. It works across industries including SaaS, retail, financial services, healthcare, and ecommerce where quarterly and annual growth reporting is a regular communication requirement.
Login to download this file
What do you think of this template?
-
Category:
Charts & Graphs -
-

-

Aspect Ratio: 16:9
-

Item ID: SPT0732
-

Designed by: Krishnapriya
-

Color
Related Templates
-

-

-

-
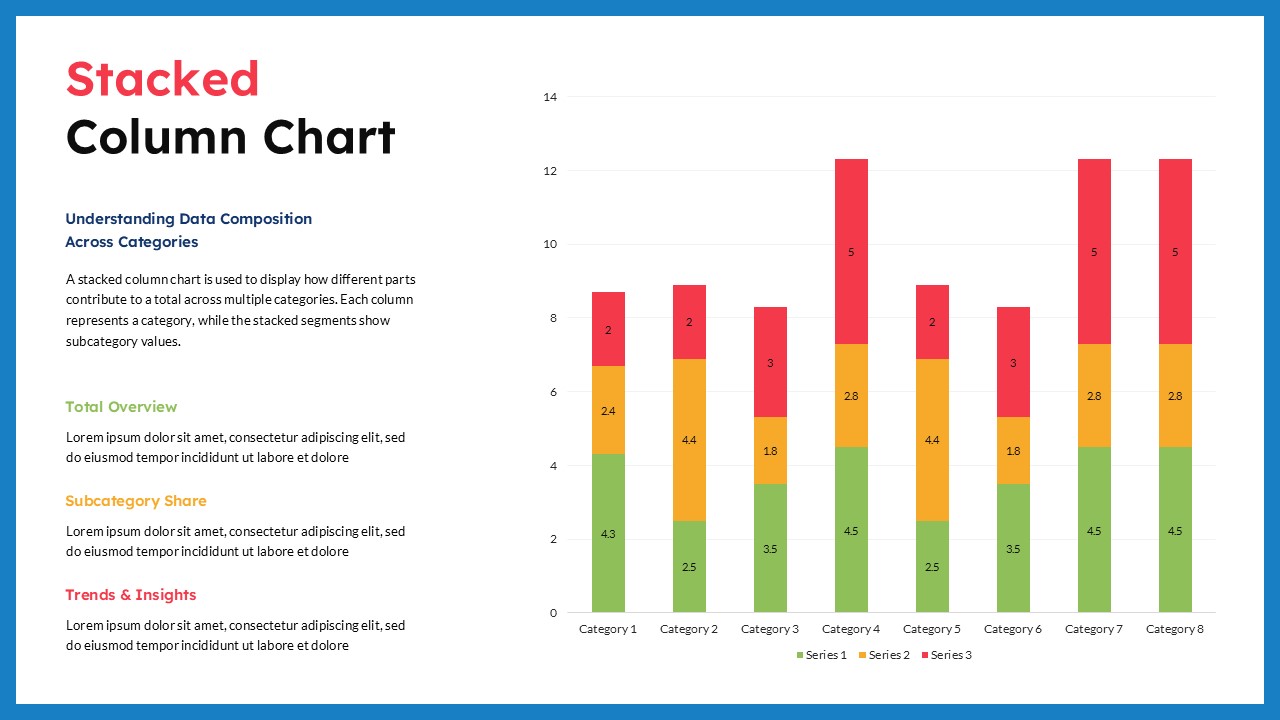
Stacked Column Chart PowerPoint Google Slides Template
Charts & Graphs
-

-

-

-

-
-

Year In Review Template for PowerPoint & Google Slides
Business Reports
-

-
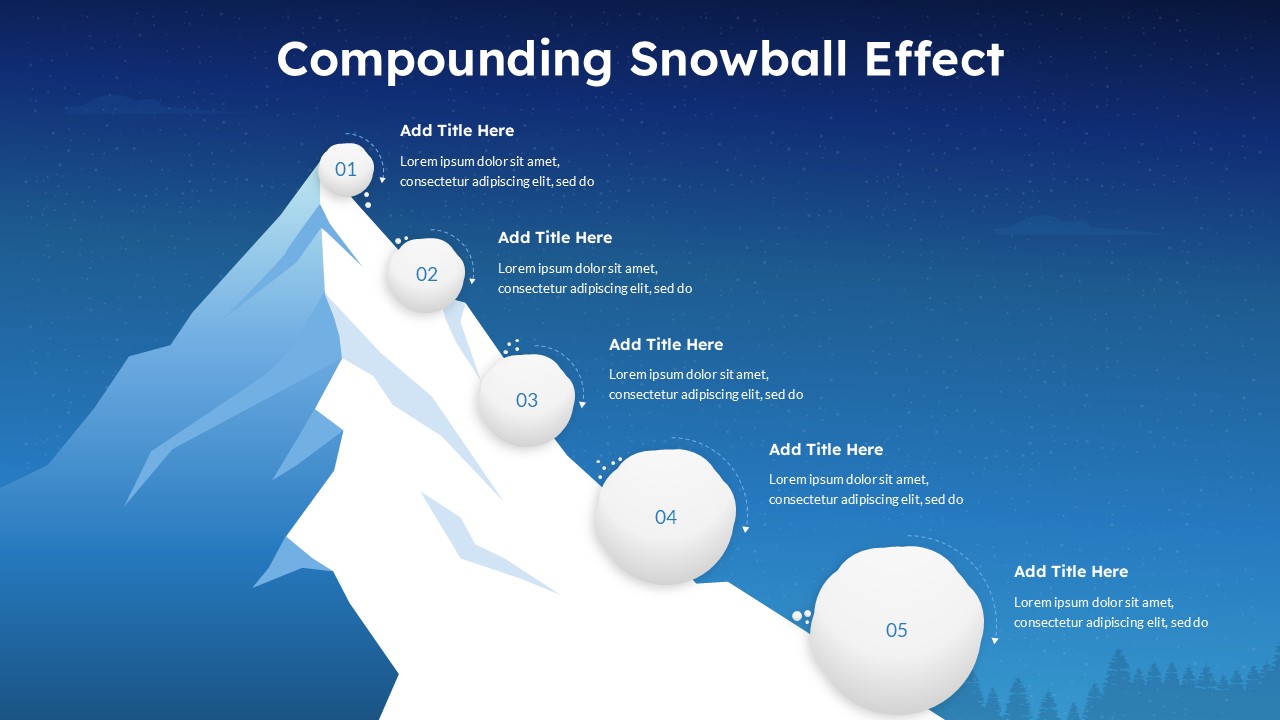
Compounding Snowball Growth Effect Template
Business Strategy


