Bowtie Diagram PowerPoint Template
Product Description
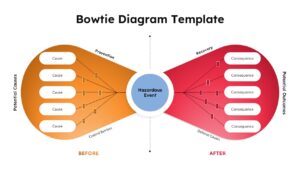
Analyze risks, potential causes, preventive controls, and possible outcomes with this professional Bowtie Diagram PowerPoint Template. Designed for risk assessment, safety management, business continuity, operational planning, and hazard analysis, this PPT template provides a clear visual framework for showing how potential causes can lead to a hazardous event and how control measures can reduce the likelihood or impact of unwanted outcomes.
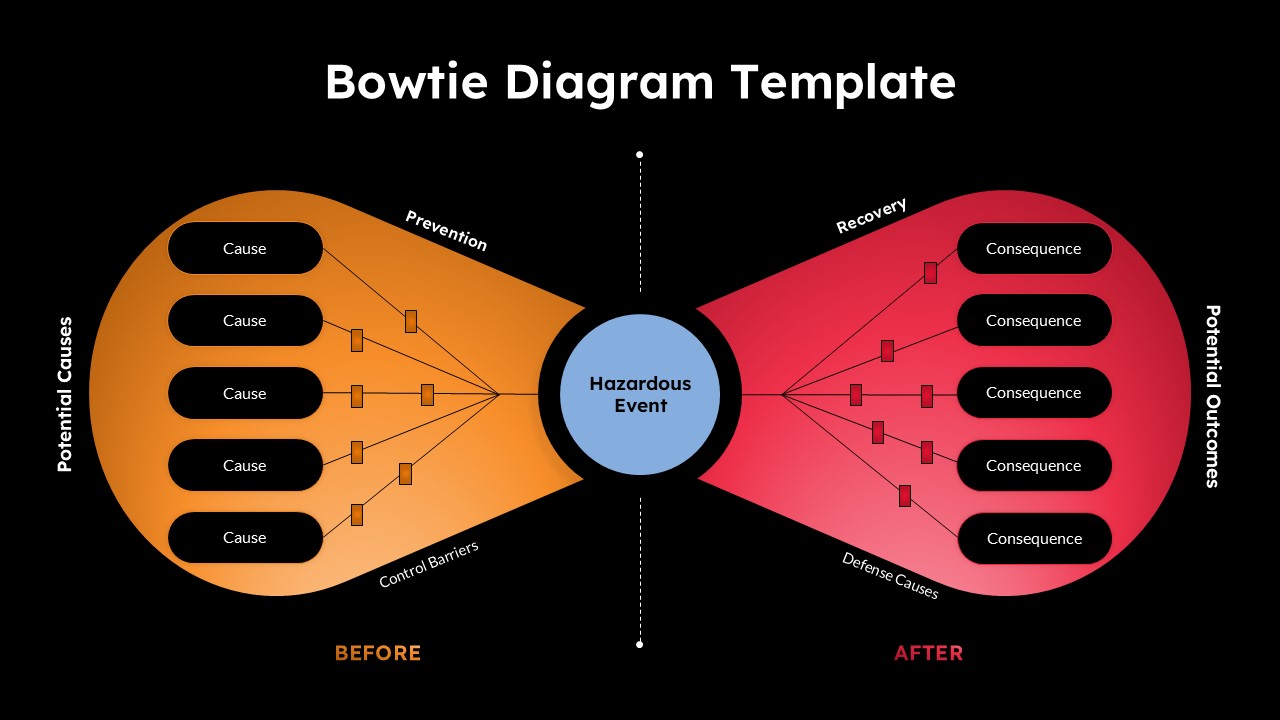
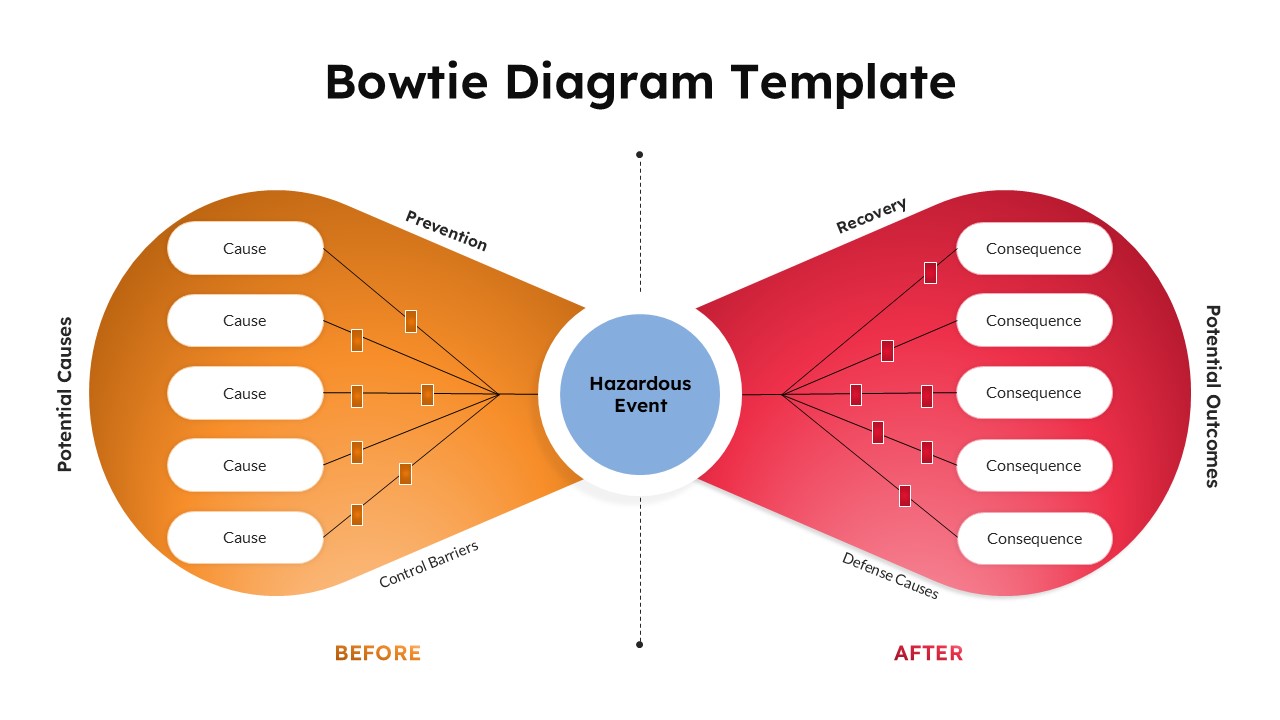
The diagram places a central Hazardous Event between two connected sides. The left side presents potential causes and prevention measures, while the right side shows potential outcomes, recovery measures, and defensive controls. This structure makes the Bowtie Diagram PPT useful for explaining cause and effect relationships while showing the barriers used to prevent or control risk.
This Bowtie Diagram PowerPoint Template can be used across several business and professional settings. Safety teams can use it to present workplace hazards, accident prevention strategies, and safety barriers. Risk managers can use the PPT template to analyze operational risks and identify controls. Project managers can use it to explain potential threats and mitigation measures, while compliance and governance teams can use it to communicate risk management frameworks.
The left side of the Bowtie Diagram PPT Template focuses on what could cause a hazardous event and the preventive barriers that can be introduced. The right side focuses on what could happen after the event and the recovery or defense measures that can limit its impact. This makes the visual particularly useful for risk workshops, incident analysis, process safety presentations, and management reviews.
Both light and dark versions are included, giving you the flexibility to choose a presentation style that matches your project or brand. The editable structure allows you to replace the sample labels with your own risks, causes, consequences, controls, and mitigation actions.
Use this PowerPoint template for risk assessment presentations, safety training, hazard identification, operational risk reports, emergency planning, compliance presentations, project risk management, and business continuity discussions. The Bowtie Diagram PPT offers a structured way to communicate risk information while keeping the relationship between causes, events, controls, and consequences visually clear.
Frequently Asked Questions
What is a Bowtie Diagram PowerPoint Template?
A Bowtie Diagram PowerPoint Template is an editable presentation layout used to visualize the relationship between potential causes, a central hazardous event, preventive controls, possible consequences, and recovery measures. It is commonly used for risk assessment and safety management presentations.
What is a Bowtie Diagram used for?
A Bowtie Diagram is used to identify potential causes of an unwanted event, show the barriers that can prevent it, and illustrate possible consequences along with recovery or mitigation controls. It is useful for safety, operational risk, compliance, and business continuity analysis.
Login to download this file
What do you think of this template?
-
Category:
Business -
-

-

Item ID: SPT0838
-

Designed by: Niranjana
-

Color
Related Templates
-
-

-

-

Rapid Model Process Diagram Template for PowerPoint & Google Slides
Project Management
-

-

-

-

-
-
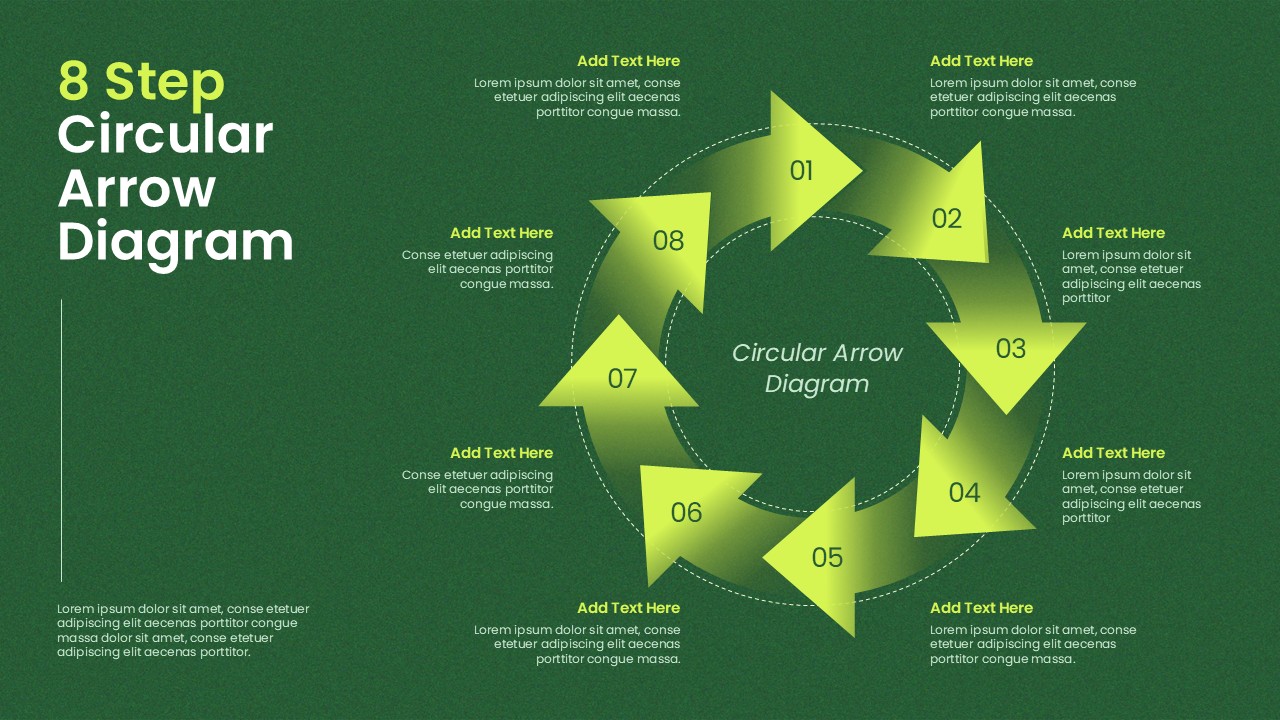
8 Step Circular Arrow Diagram PowerPoint Template
Infographics
-
-