Blank Web Chart Template for PowerPoint
Product Description
A blank web chart is a diagram format built around a central hub connected to multiple surrounding nodes by lines or arrows. Unlike a flowchart that moves in a single direction or a timeline that follows a sequence, a web chart places one idea at the center and branches outward equally in all directions, treating every connected node as an equally weighted component. This makes it one of the most flexible diagram structures in business and academic presentations, because the blank format imposes no predefined hierarchy, no fixed labels, and no assumed relationship type between the nodes. The presenter decides what the center represents and what each branch means.
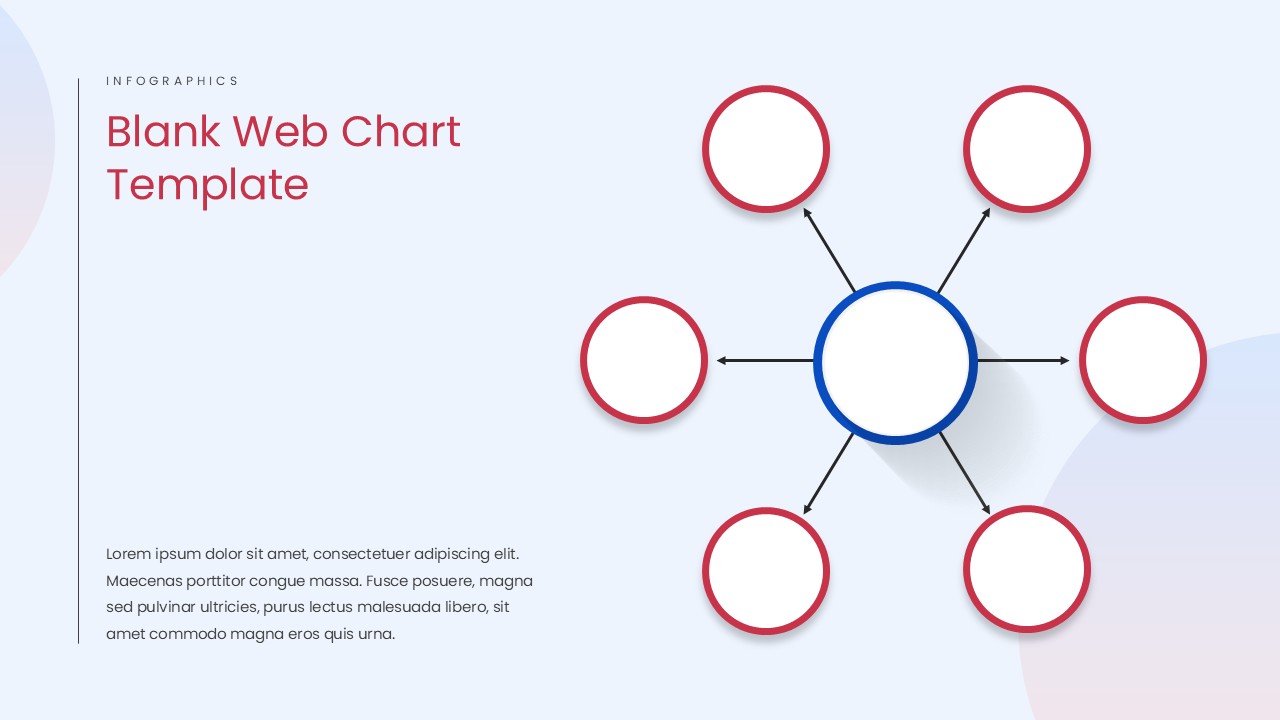
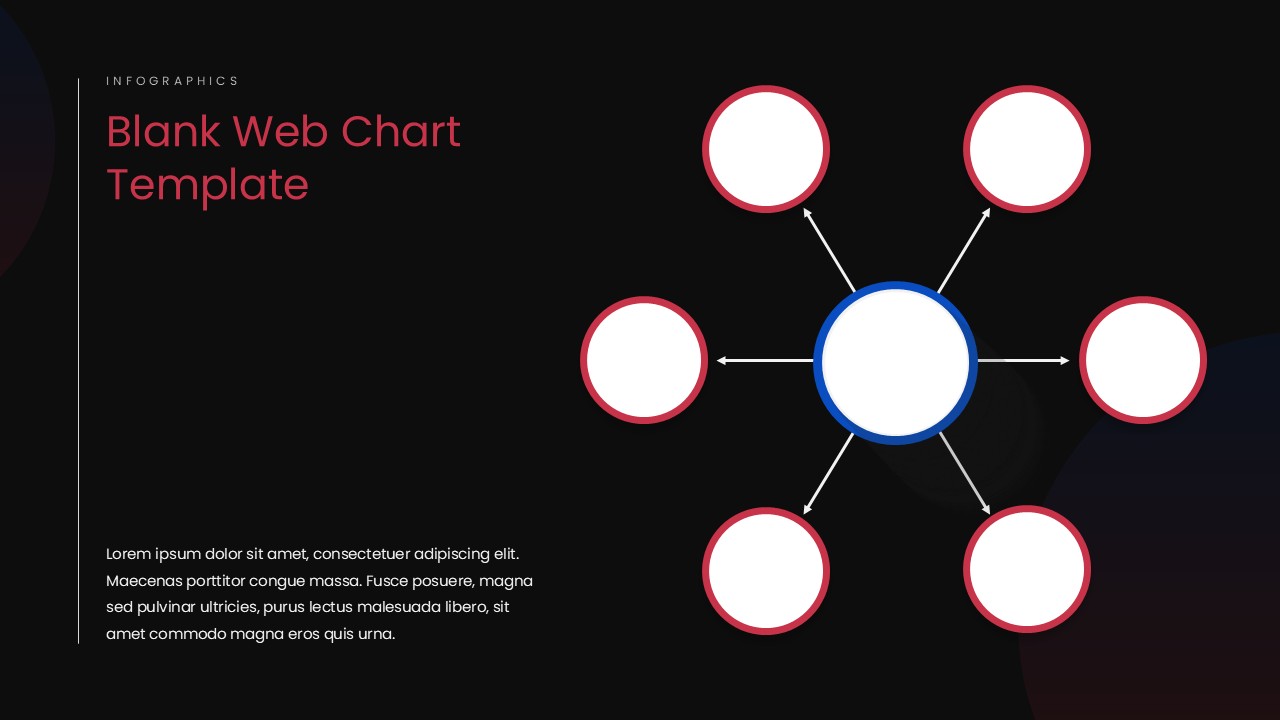
The Blank Web Chart Template for PowerPoint brings this structure to life on a single slide. A blue-rimmed central circle sits at the midpoint of the diagram, connected to six red-rimmed satellite circles via bidirectional arrows that radiate outward in a symmetrical arrangement across a soft lavender gradient background. The left side of the slide holds a title block with a vertical accent bar and a paragraph text placeholder below it, giving presenters space to introduce or explain the diagram without crowding the visual. All circles, arrows, and text areas are native PowerPoint shapes that can be resized, recolored, and relabeled freely.
Professionals across industries rely on web chart diagrams for different purposes. Business strategists use them to map a core objective against the six key drivers that support it. Product teams use them to connect a central product to its primary features or user personas. Educators build concept maps around a central topic and link it to subtopics for classroom discussion. HR teams use them to visualize an organization at the center with its key stakeholder groups fanning outward. The blank format means none of these use cases require any structural editing, only label and color changes.
The template is 100% editable in PowerPoint, & Google Slides. Users can add or remove nodes, change the arrow direction, replace the bidirectional arrows with one-way connectors, and apply any color palette to match their brand or presentation theme. Also, check out our collection of infographic PowerPoint templates.
Frequently Asked Questions
How is a web chart different from a mind map?
A web chart and a mind map share a similar hub and spoke structure, but a web chart typically uses a fixed number of equally weighted nodes arranged symmetrically around a central idea, while a mind map branches outward at multiple levels with sub-nodes extending from each primary branch. This template uses a single-level web chart format with six nodes, making it simpler and faster to read in a presentation setting.
Can I use this blank web chart template for purposes other than business presentations?
Yes. The blank format makes this web chart template equally useful outside of business settings. Teachers can use it as a classroom concept mapping tool by placing a lesson topic in the center and connecting it to six key ideas or discussion points. Students can use it for essay planning, research organization, or study notes. Researchers can map a central hypothesis against six supporting variables. The six-node structure works for any subject where a central idea needs to be visually connected to a defined set of related components, regardless of the industry or academic discipline.
Login to download this file
What do you think of this template?
-
Category:
Diagrams -
-

-

Item ID: SPT0741
-

Designed by: Athira
-

Color
Related Templates
-
-

-

-
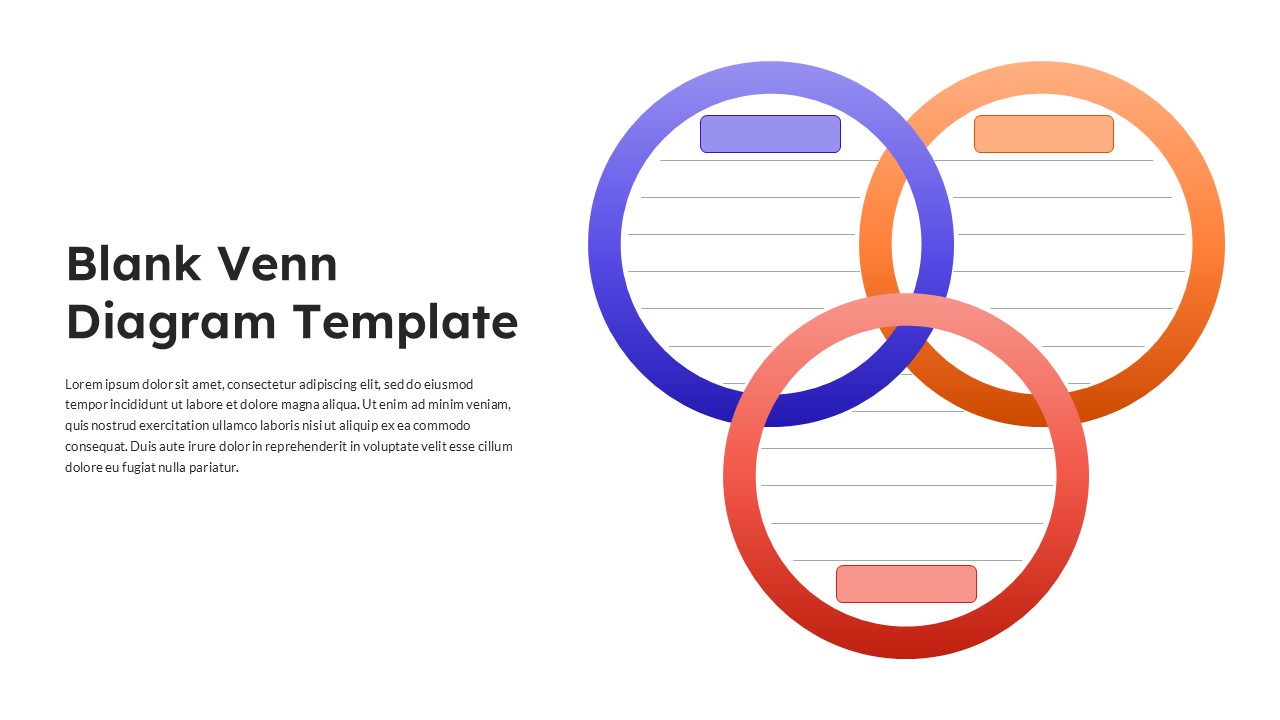
Blank Venn Diagram Template
Diagrams
-

Blank Swot Analysis Template PowerPoint & Google Slides Template
Business Strategy
-

-

Free Blank Timeline Arrow PowerPoint Template
Infographics
-

-

-

Editable Blank Timeline Template
Business
-

IT Governance Framework Template Editable in PowerPoint & Google Slides
Business Strategy
-