Annual Cycle Infographic Diagram Presentation Template


Product Description
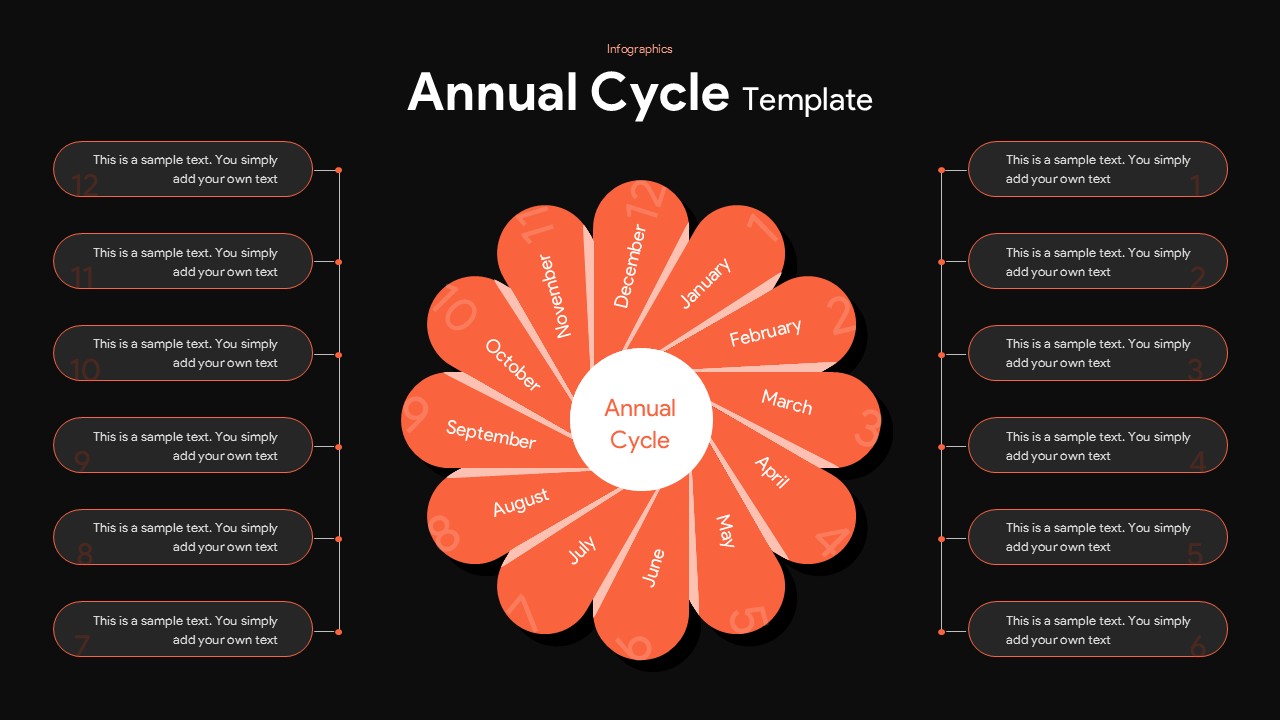
Visualize yearly workflows, recurring processes, and month-by-month planning with this professionally designed annual cycle infographic template. The creative flower-shaped circular layout organizes all twelve months into connected segments radiating around a central hub, making complex yearly activities easier to understand and present to any audience. Each month segment is paired with editable side callout boxes where presenters can attach descriptions, milestones, goals, or performance highlights in a clean and structured format. The circular infographic structure also aligns naturally with related cycle templates commonly used for recurring workflows and operational planning. Modern typography, rounded shapes, and subtle shadow effects combine with both light and dark theme variations to create a visually engaging slide that suits business, education, project planning, and marketing reports equally well. Every segment is fully customizable, allowing users to edit colors, labels, icons, and supporting text to match branding or specific presentation requirements. Optimized for widescreen formats, the template maintains high visual quality across both PowerPoint and Google Slides.
Project managers, business strategists, marketing teams, HR professionals, consultants, educators, and operations managers will find this template useful for annual roadmaps, campaign schedules, budgeting cycles, content planning, academic schedules, employee engagement calendars, monthly KPI reporting, and strategic milestone presentations.
Download the template today and turn your yearly plan into a clear and compelling visual story.
Frequently Asked Questions
Can I customize all twelve month segments in this annual cycle infographic template?
Yes. Every month segment, callout box, color, icon, text placeholder, and design element is fully editable in both Microsoft PowerPoint and Google Slides, allowing you to tailor the template to your branding and presentation requirements.
What types of presentations is this annual cycle infographic best suited for?
This template is ideal for annual roadmaps, marketing calendars, project timelines, budgeting cycles, employee engagement plans, academic schedules, KPI reporting, operational workflows, and strategic planning presentations that require a clear month-by-month visual structure.
Login to download this file
What do you think of this template?
-
Category:
Diagrams -
-

-

Aspect Ratio: 16:9
-

Item ID: SPT0701
-

Designed by: Athira
-

Color
Related Templates
-

-

PDCA Cycle Process Diagram Presentation Template
Business Strategy
-

-

-

-

-

-

-

-

-

-


