Two Circle Venn Diagram Template PowerPoint and Google Slides Template


Product Description
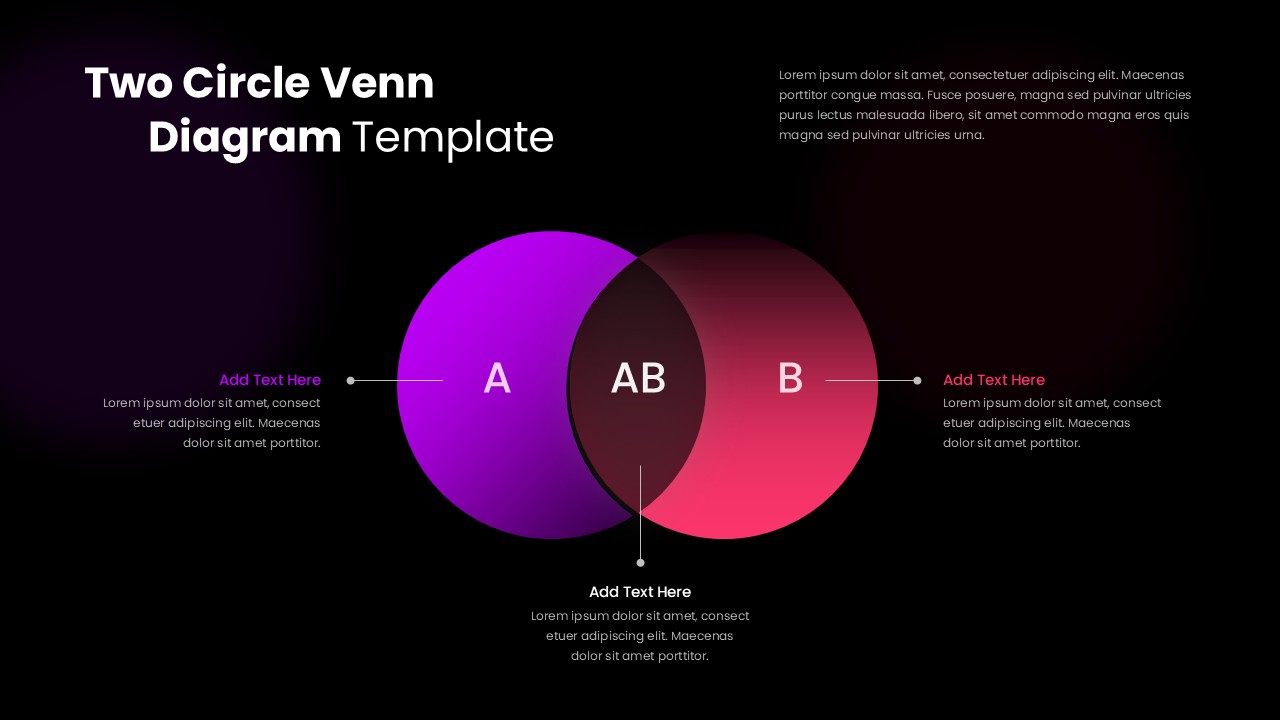
Some of the most powerful analytical insights come down to understanding what two things share and what separates them, and this Two Circle Venn Diagram Template gives educators, business analysts, marketing strategists, consultants, and students a visually striking, dark-themed diagram that communicates that relationship with immediate clarity. The deep black background with vibrant purple and pink gradient circles creates a premium, high-contrast visual that stands out in any presentation environment, from a classroom projector to a boardroom screen.
The diagram is structured around two large overlapping circles labeled A and B, with the intersection zone clearly marked as AB. Three annotation callouts connect to the diagram with clean connector lines, one for each circle’s unique attributes and one for the shared overlap, giving presenters a complete framework to describe what makes each concept distinct and what connects them. The top-right text panel provides additional space for a framing statement or context paragraph, making the slide self-contained without requiring a separate introduction slide.
- Circle A in gradient purple represents the first concept or subject with its own dedicated annotation panel on the left, giving presenters space to describe the unique attributes, characteristics, or qualities that belong exclusively to that side of the comparison.
- Circle B in gradient pink carries the second concept on the right with its own matching annotation panel, maintaining visual symmetry that makes the comparison feel balanced and objective rather than favoring one side of the analysis.
- The AB intersection zone at the center is the strategic heart of the diagram, the space where shared qualities, common ground, or areas of mutual relevance live, and the bottom callout panel gives presenters a clearly labeled, visually anchored place to articulate those shared elements explicitly.
- The dark background with glowing gradient circles gives the slide a modern, data-visualization aesthetic that works particularly well in technology, innovation, and strategic analysis presentations where a clinical white slide would feel inconsistent with the subject matter.
A Venn Diagram Presentation Template
Every text placeholder, circle color, label, and connector line is fully editable, making this two circle Venn diagram reusable across entirely different comparison scenarios without any layout changes. It works seamlessly in both Microsoft PowerPoint and Google Slides, so whether your team is building a client deliverable, a classroom lesson, or a strategic planning deck, you can customize and present it on whichever platform your audience expects without any formatting issues.
Frequently Asked Questions
What is a Two Circle Venn Diagram Template?
A Two Circle Venn Diagram Template is a pre-designed presentation slide that uses two overlapping circles to visually map the unique attributes of two subjects alongside their shared qualities in the intersection zone. It gives presenters a structured, visually clear way to communicate comparisons, relationships, and overlap analysis without relying on dense text or complex tables.
Who should use this Two Circle Venn Diagram Template?
This template is built for educators, business analysts, marketing strategists, product managers, management consultants, and students who need to present structured comparisons, competitive analyses, or conceptual relationship diagrams to any audience. It works across education, corporate strategy, market research, product positioning, and academic research contexts where understanding the relationship between two subjects drives better thinking and clearer communication.
Login to download this file
What do you think of this template?
-
Category:
Diagrams -
-

-

Item ID: SPT0771
-

Designed by: Athira
-

Color
Related Templates
-

-

-

-

-

-

-

Balanced Scorecard Circle Template for PowerPoint & Google Slides
Business Strategy
-

-

-

-

-


