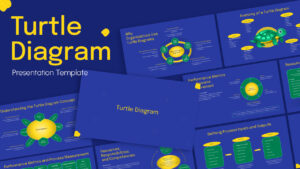
Turtle Diagram PowerPoint Presentation Template


Product Description
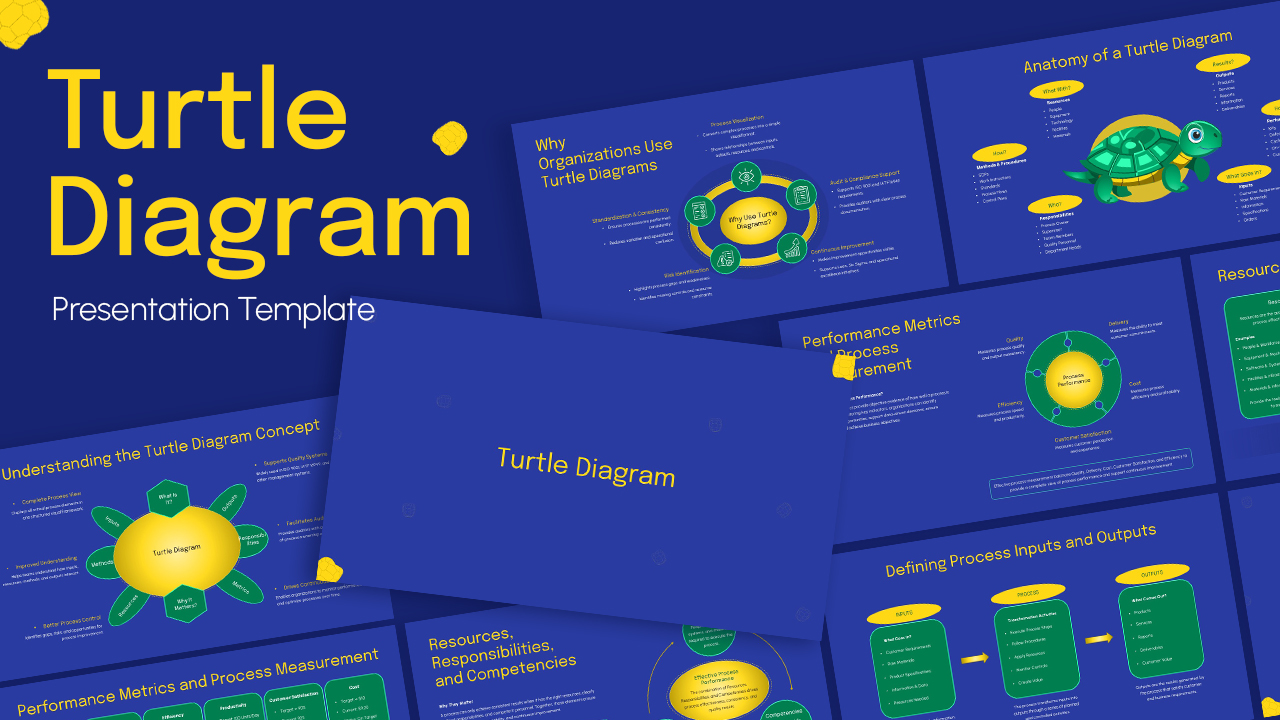
The Turtle Diagram PowerPoint Presentation Template is a process documentation slide deck designed for quality engineers, ISO compliance officers, and operations managers who need to present process analysis findings in internal audits, management reviews, and continuous improvement sessions. The template applies a consistent royal blue background with yellow title typography and green diagram components across all slides, creating a visually distinct deck that stands apart from generic business presentations. Each diagram, chart, table, and text placeholder is built as an editable PowerPoint shape that users can modify, resize, and recolor to match their organization’s documentation standards.
This Turtle Diagram presentation template contains 10 slides organized to walk an audience through the complete turtle diagram framework from concept to measurement:
- Title Slide – Royal blue opening slide with gold script title and repeating turtle shell watermark pattern in the background
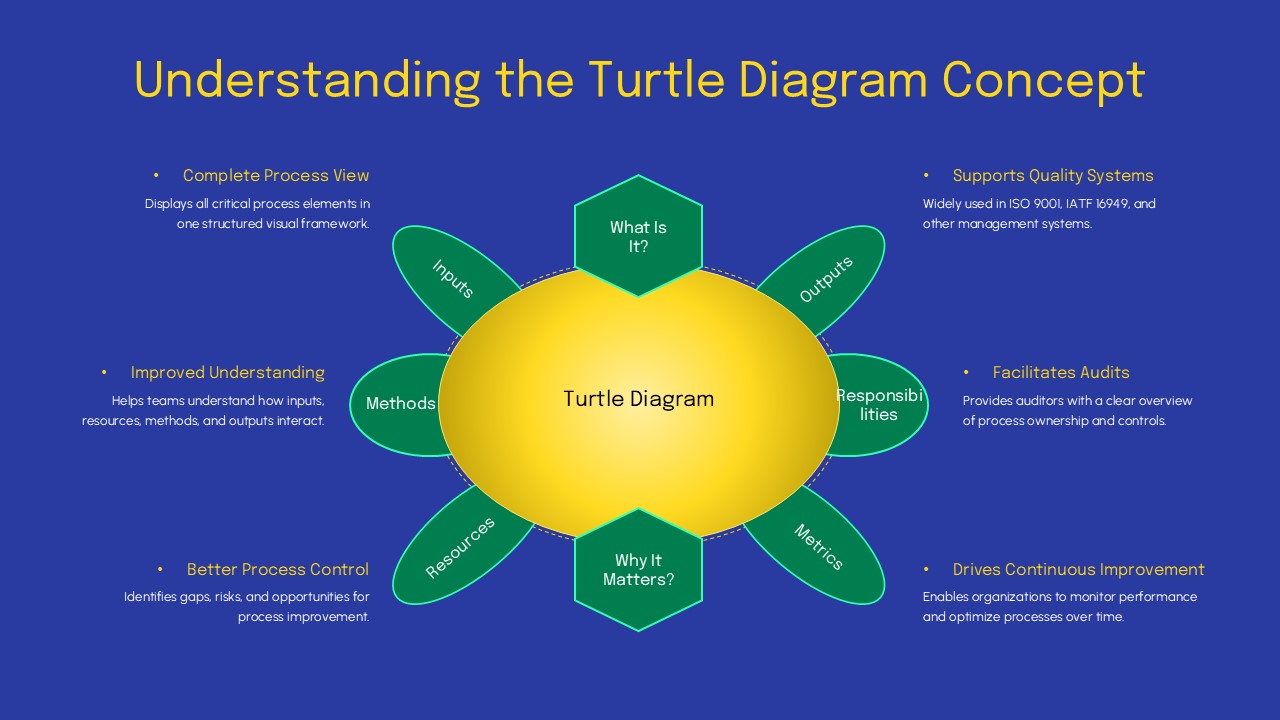
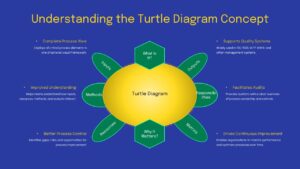
- Understanding the Turtle Diagram Concept – Flower-shaped hub and spoke diagram with labeled petals for Inputs, Outputs, Methods, Resources, Responsibilities, and Metrics, with six surrounding benefit panels covering Complete Process View, Supports Quality Systems, Improved Understanding, Facilitates Audits, Better Process Control, and Drives Continuous Improvement
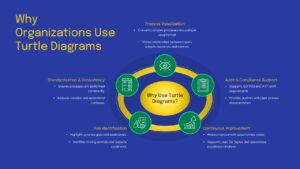
- Why Organizations Use Turtle Diagrams – Four-node circular icon diagram covering Process Visualization, Standardization and Consistency, Risk Identification, Audit and Compliance Support, and Continuous Improvement
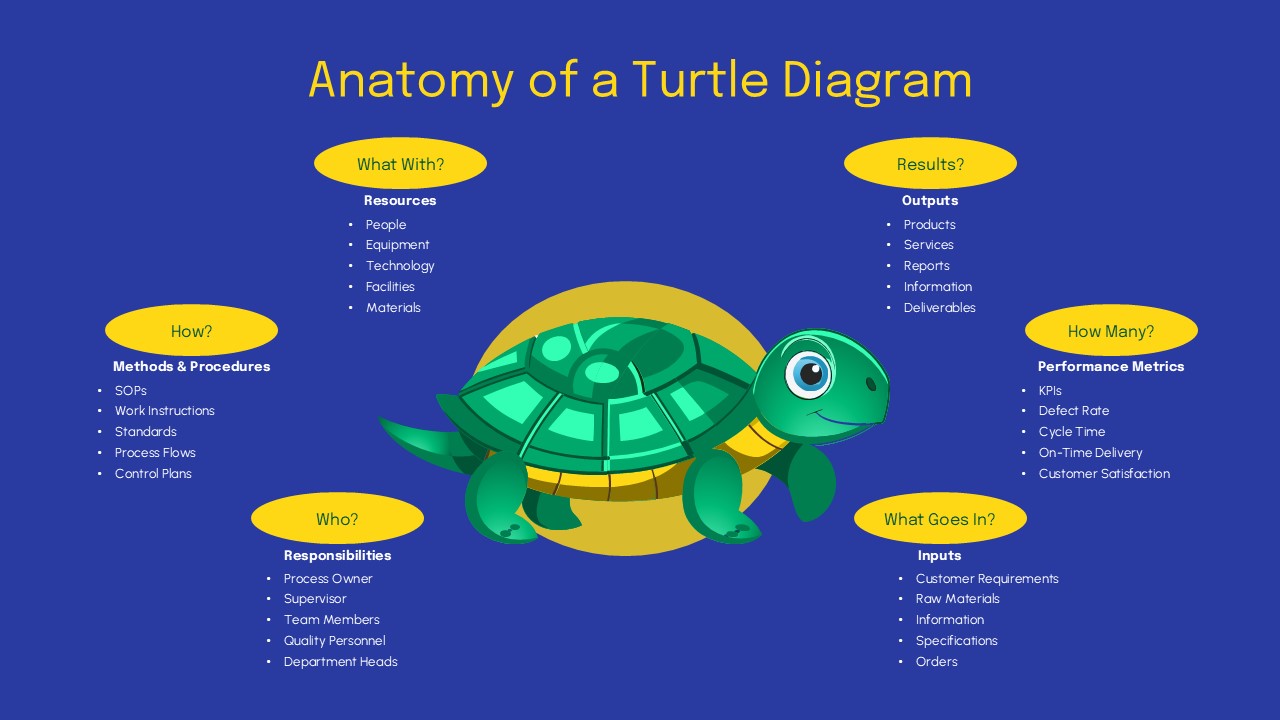
- Anatomy of a Turtle Diagram – Illustrated turtle character with six labeled callout sections mapping each part of the turtle body to a process element: Resources, Methods and Procedures, Responsibilities, Inputs, Outputs, and Performance Metrics
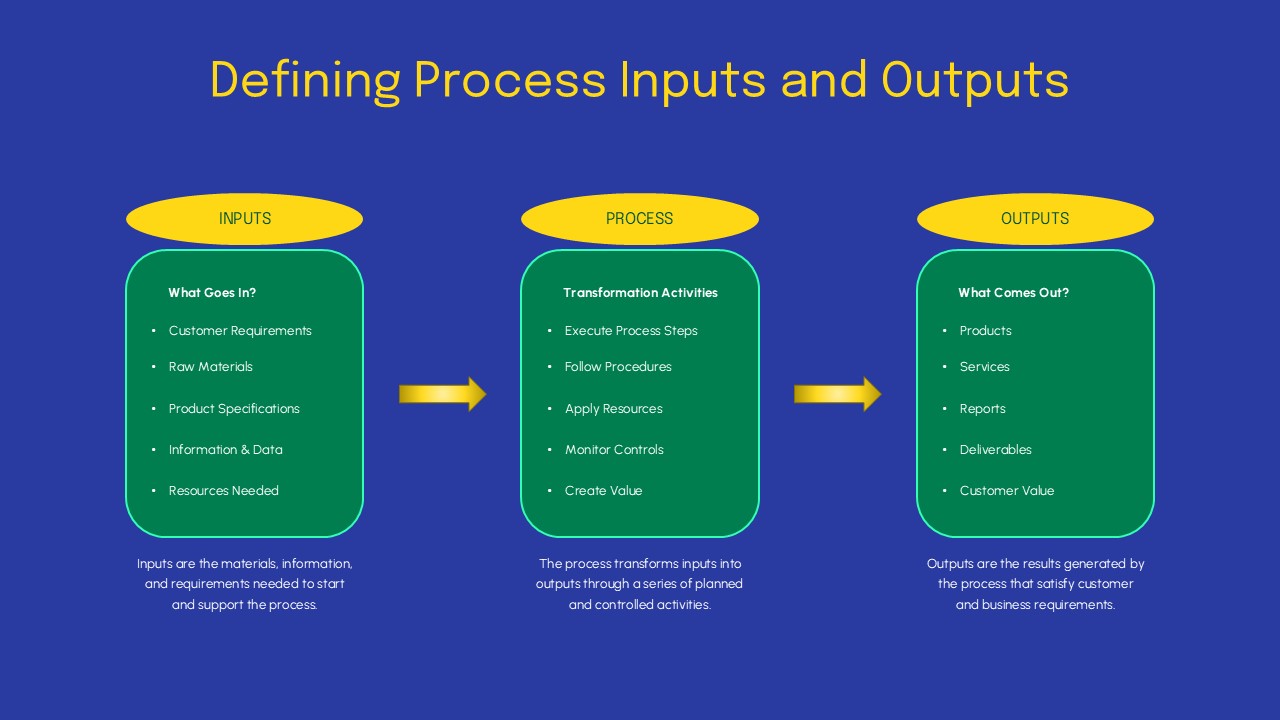
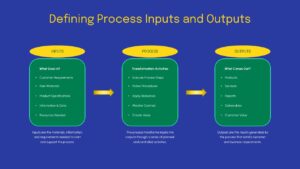
- Defining Process Inputs and Outputs – Three-column green card layout covering Inputs (What Goes In), Process (Transformation Activities), and Outputs (What Comes Out) with bullet lists and supporting description text beneath each panel
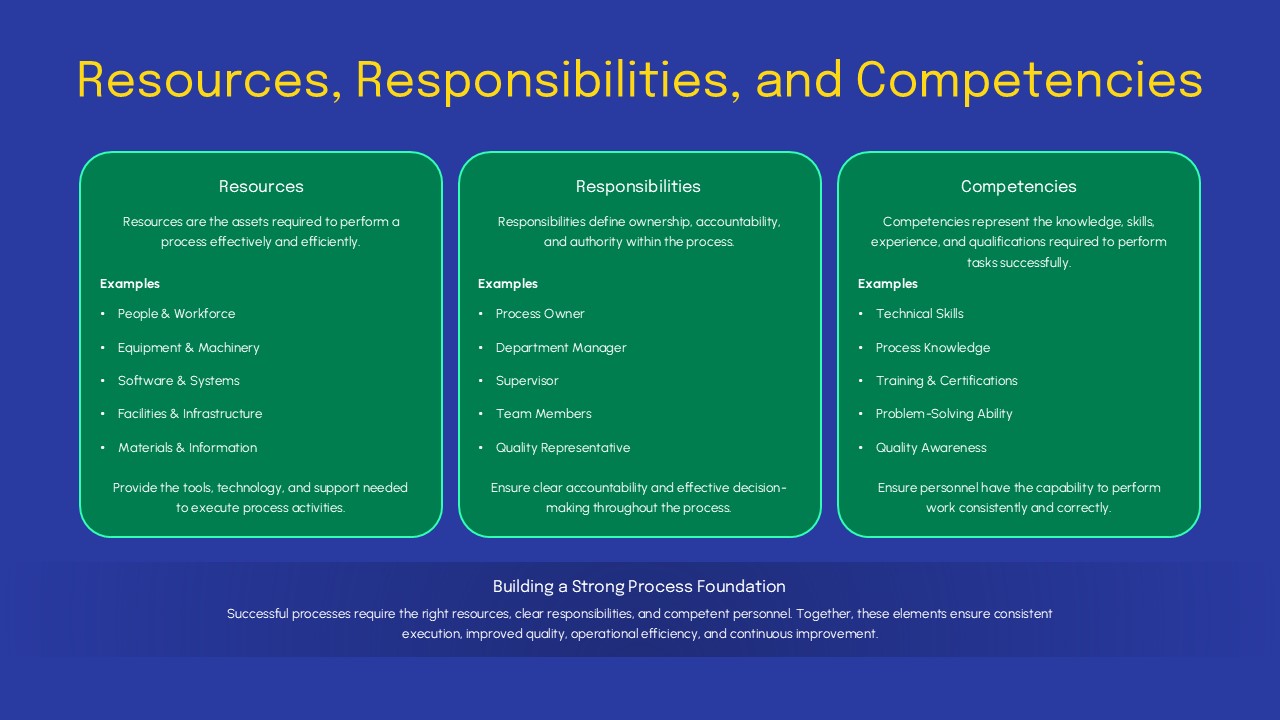
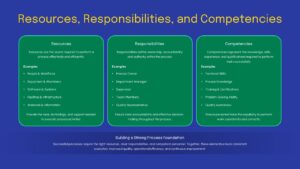
- Resources, Responsibilities, and Competencies (Card Layout) – Three green panel cards defining each element with example bullet lists and a Building a Strong Process Foundation summary statement at the bottom
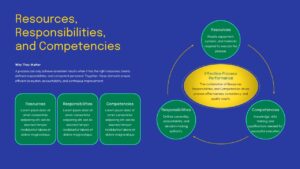
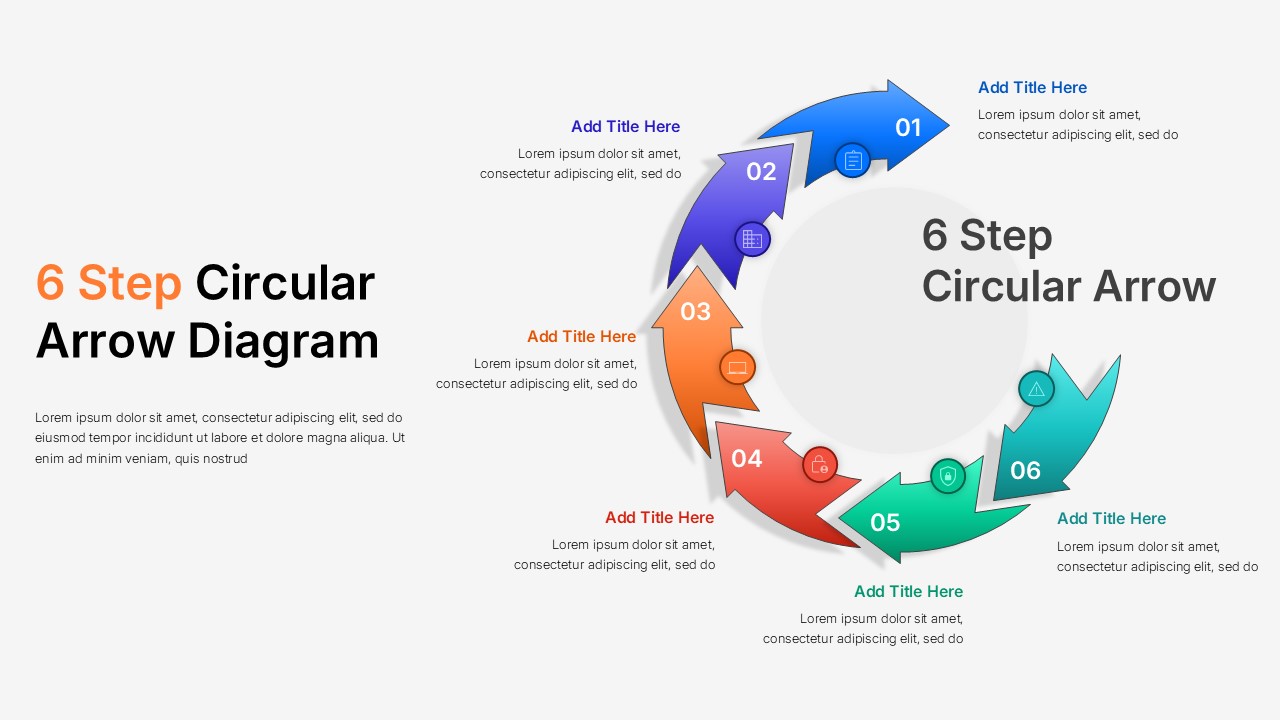
- Resources, Responsibilities, and Competencies (Cycle Diagram) – Circular arrow diagram connecting Resources, Responsibilities, and Competencies around a central Effective Process Performance oval, with supporting text boxes beneath each node
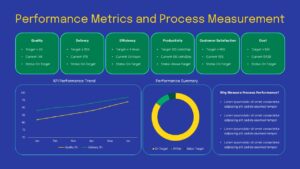
- Performance Metrics and Process Measurement (KPI Dashboard) – Six green KPI cards for Quality, Delivery, Efficiency, Productivity, Customer Satisfaction, and Cost, each showing target, current value, and status, paired with a KPI Performance Trend line chart and a Performance Summary donut chart
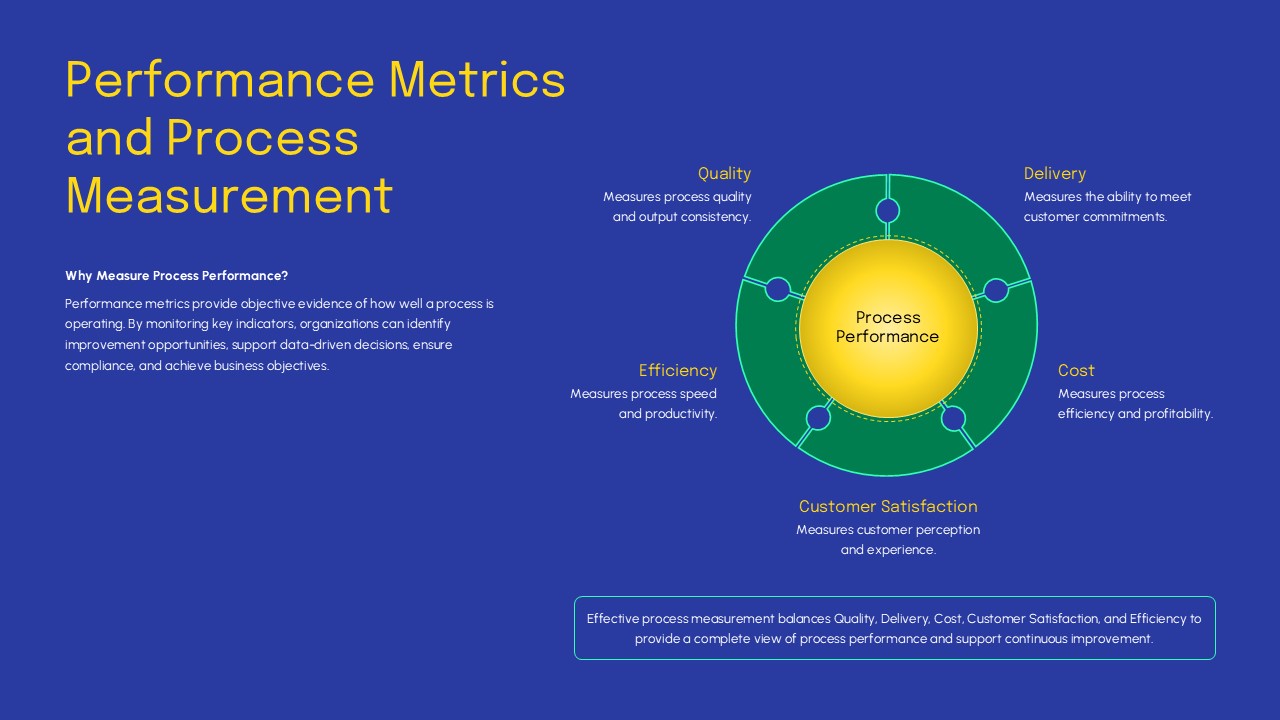
- Performance Metrics and Process Measurement (Circular Model) – Five-point circular diagram mapping Quality, Delivery, Cost, Customer Satisfaction, and Efficiency around a central Process Performance label with short descriptions per node
- Thank You Slide – Closing slide matching the title design with gold typography on royal blue background
A turtle diagram is a process mapping tool widely adopted in ISO 9001 quality management systems and IATF 16949 automotive quality standards to document how a specific process operates. The diagram captures the six essential elements of any process: what goes in, what comes out, what resources are needed, what methods are followed, who is responsible, and how performance is measured. Quality teams use this tool during process audits to verify that all process elements are defined, controlled, and performing within acceptable limits. Organizations that implement turtle diagrams as part of their quality documentation framework report clearer process ownership, faster audit preparation, and more consistent process execution across departments. Download and edit this Turtle Diagram PowerPoint Presentation Template for your next quality review or audit preparation session.
Frequently Asked Questions
What is a turtle diagram in quality management?
A turtle diagram is a process documentation tool used in ISO 9001 and IATF 16949 quality management systems to map the six core elements of a process: inputs, outputs, resources, methods, responsibilities, and performance metrics, in a single structured visual.
How is a turtle diagram used in an ISO audit?
During an ISO audit, a turtle diagram is used to demonstrate that each process element is clearly defined, controlled, and measurable. Auditors review the diagram to verify process ownership, input and output specifications, resource availability, and performance indicators against quality targets.
What is the difference between a turtle diagram and a process flowchart?
A process flowchart maps the sequential steps of a process from start to finish, while a turtle diagram captures the complete context of a process by documenting what goes in and out, who is responsible, what resources and methods are used, and how performance is measured, making it a more comprehensive process analysis tool for quality management purposes.
Login to download this file
What do you think of this template?
-
Category:
Pitch Deck -
-

-

Item ID: SPT1167
-

Designed by: Niranjana
-

Color
Related Templates
-
-

-
-

Process Improvement PowerPoint & Google Slides Template
Business Strategy
-
-
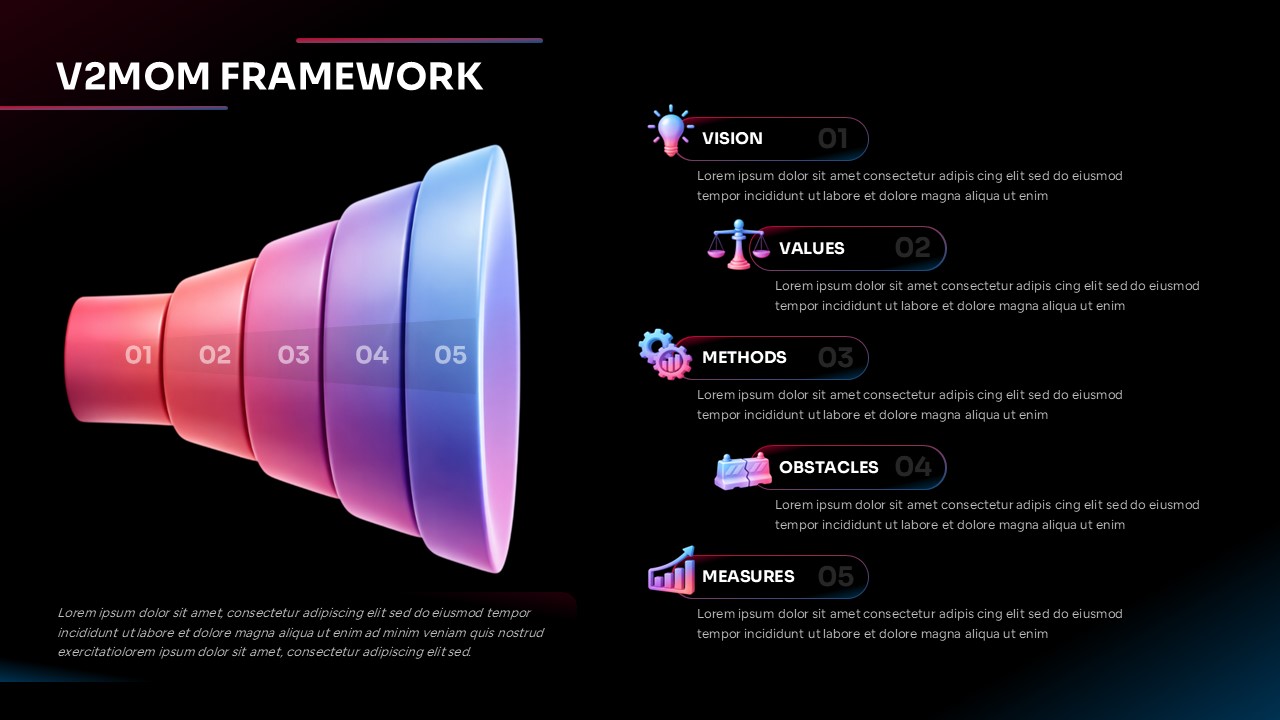
V2MOM Framework PowerPoint Template
Consulting
-

-
-

Design Process Timeline PowerPoint & Google Slides Presentation Template
Project Management
-
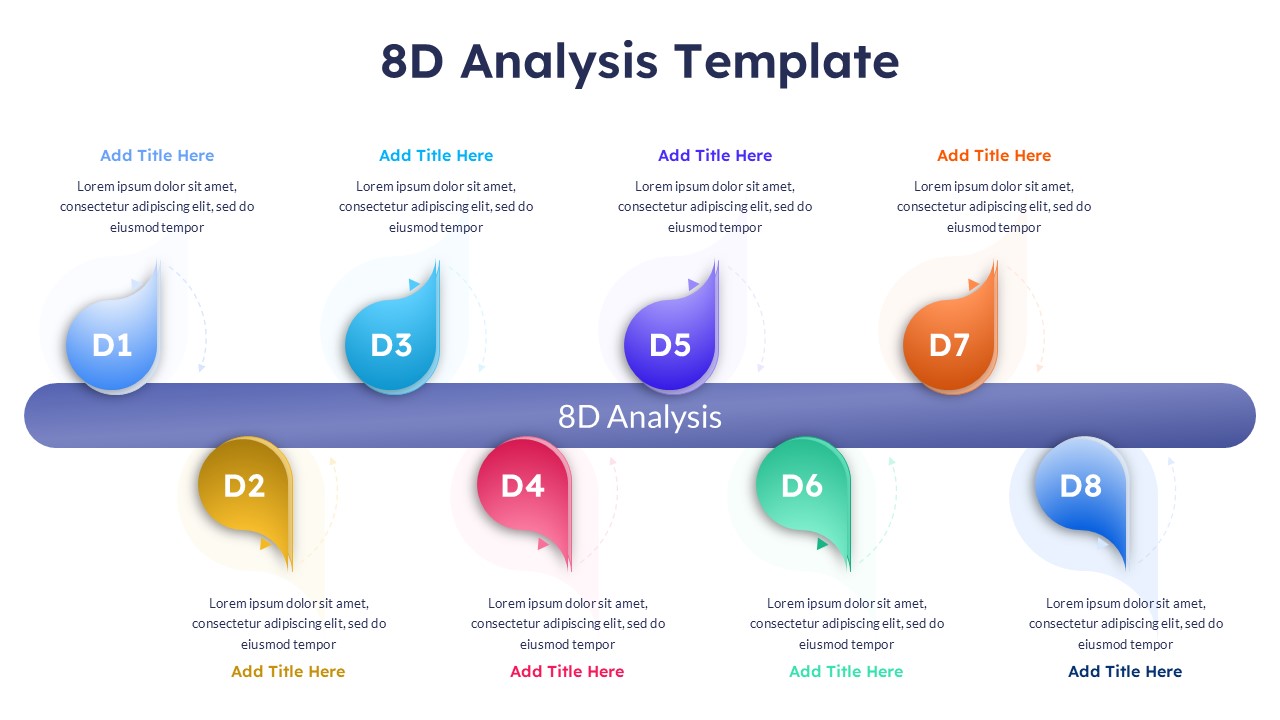
8D Analysis PowerPoint Presentation Template
Business Strategy
-

End to End Process Flow Diagram Template for PowerPoint & Google Slides
Project Management
-