Free Area Chart Dashboard Slide Presentation Template


Product Description
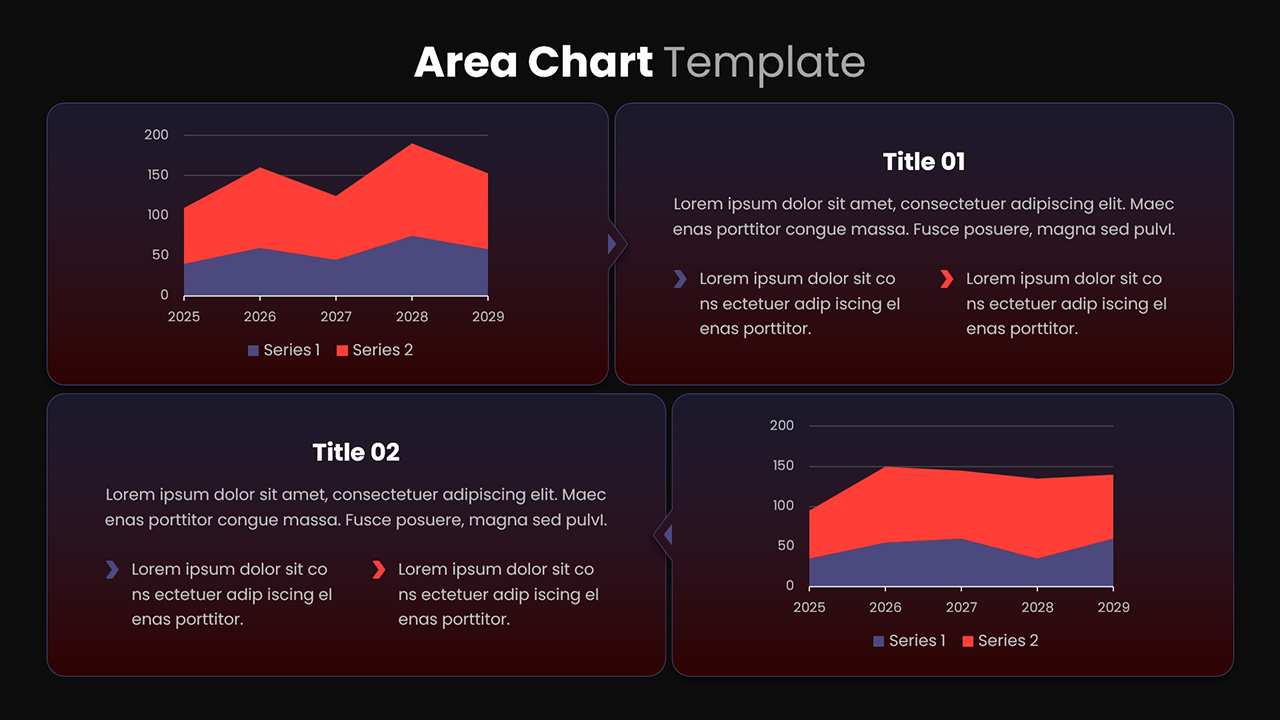
The Free Area Chart Dashboard Slide Template offers a clean and practical way to present data trends along with clear explanations in one place. It is fully editable in Microsoft PowerPoint , making it easy to customize charts, text, and colors to match your needs. You can quickly update the content without design skills, saving time during preparation. The layout is simple to adjust, so you can focus on delivering insights instead of formatting slides.
The slide includes two diagonal area charts that display multi-series data across a timeline. These visuals help show patterns, comparisons, and changes clearly. Alongside the charts, there are text sections where you can explain key points and add supporting details. This combination ensures your audience understands both the numbers and the meaning behind them.
Key Benefits:
- Clear data presentation that improves audience understanding
- Saves time with ready-made layout and structured design
- Easy editing of charts, text, and colors without technical effort
- Balanced layout that guides attention between visuals and insights
- Helps simplify complex information into readable points
The modern style, clean typography, and organized structure make this template suitable for business reports, marketing reviews, and performance analysis. It supports better storytelling by combining visuals with concise explanations. If you need a reliable and efficient way to present your data, this template is a strong choice. Download it now and start creating clear, professional presentations right away.
Login to download this file
What do you think of this template?
-
Category:
Charts & Graphs -
-

-

Aspect Ratio: 16:9
-

Item ID: SPT0045
-

Designed by: Krishnapriya
-

Color
Related Templates
-

-

-

-

-

-

-

-

-

-

-

Free Column Chart Comparison Presentation Template
Charts & Graphs
-
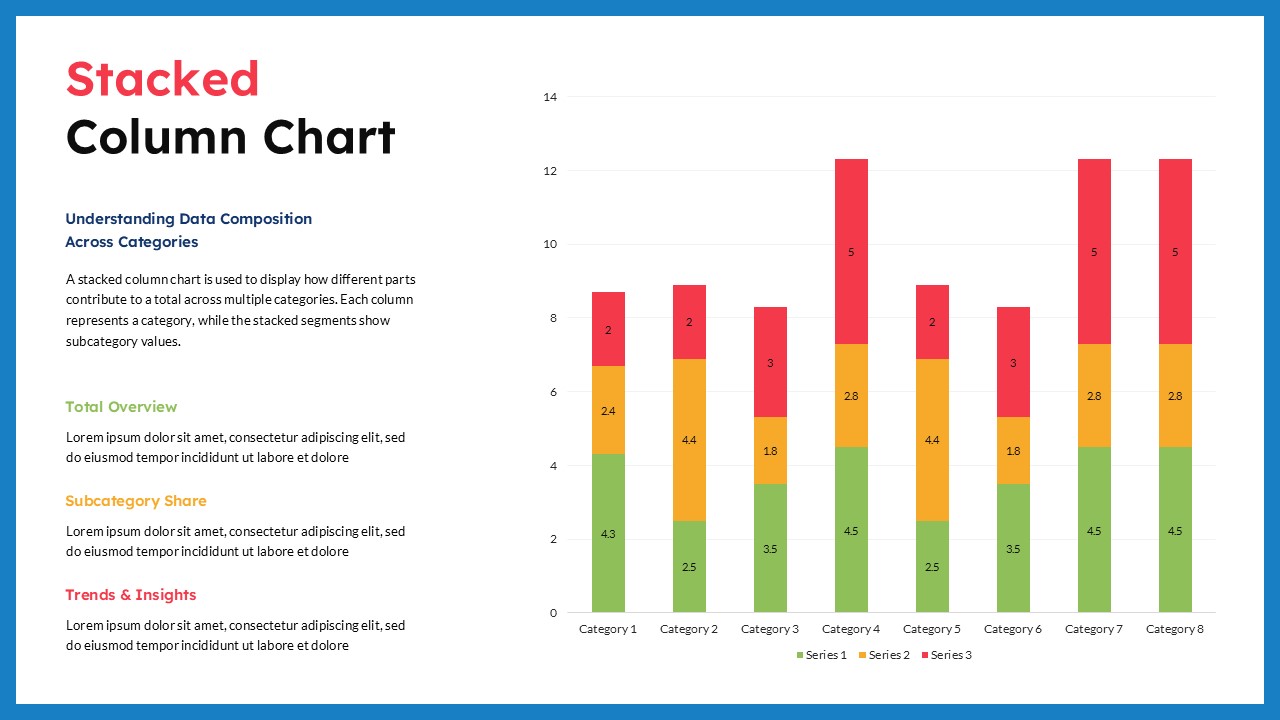
Stacked Column Chart PowerPoint Google Slides Template
Charts & Graphs


