Triple Venn Diagram PowerPoint Template
Product Description
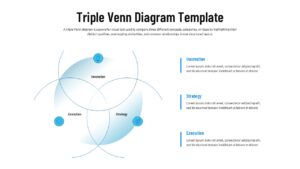
A Triple Venn Diagram is a visual framework used to compare three related concepts while highlighting their individual characteristics and shared relationships. It helps presenters organize information into distinct sections, making it easier to explain intersections, dependencies, and common objectives within a single illustration. The Triple Venn Diagram PowerPoint Template transforms this analytical model into a polished presentation slide that communicates complex comparisons with clarity and visual balance.
Strategy consultants often use a triple Venn diagram to illustrate how business strategy, technology, and operations align to achieve organizational goals. Product managers can present the relationship between customer needs, market opportunities, and product capabilities when defining a roadmap. Marketing teams use the diagram to compare audience segments, campaign objectives, and communication channels, while educators and researchers apply it to explain theories, classifications, and overlapping concepts. Regardless of the subject, the diagram keeps discussions focused by presenting multiple perspectives in one connected visual.
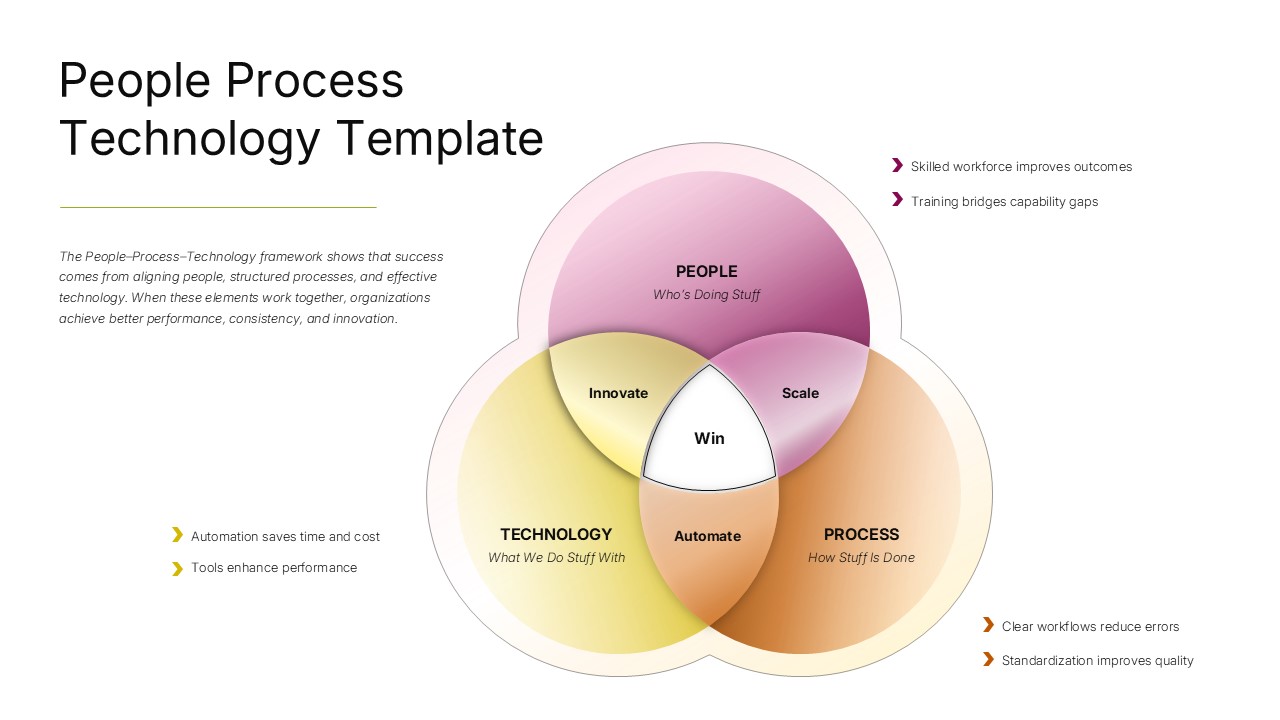
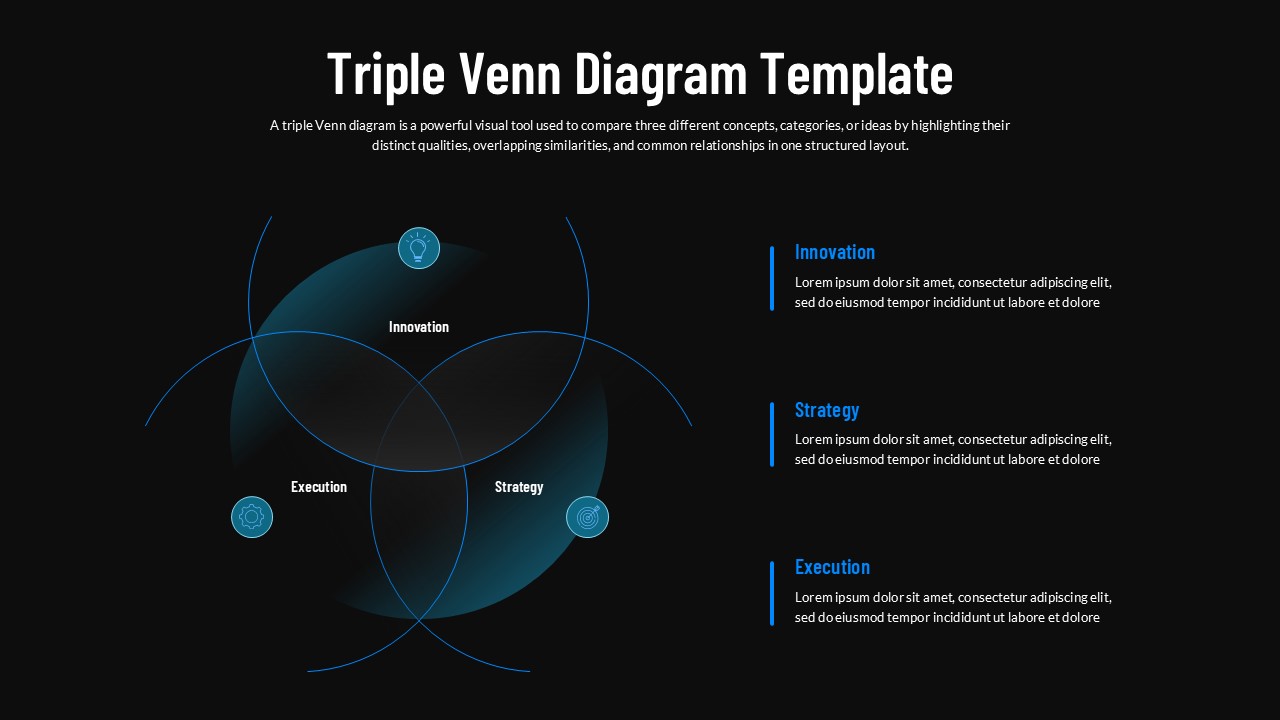
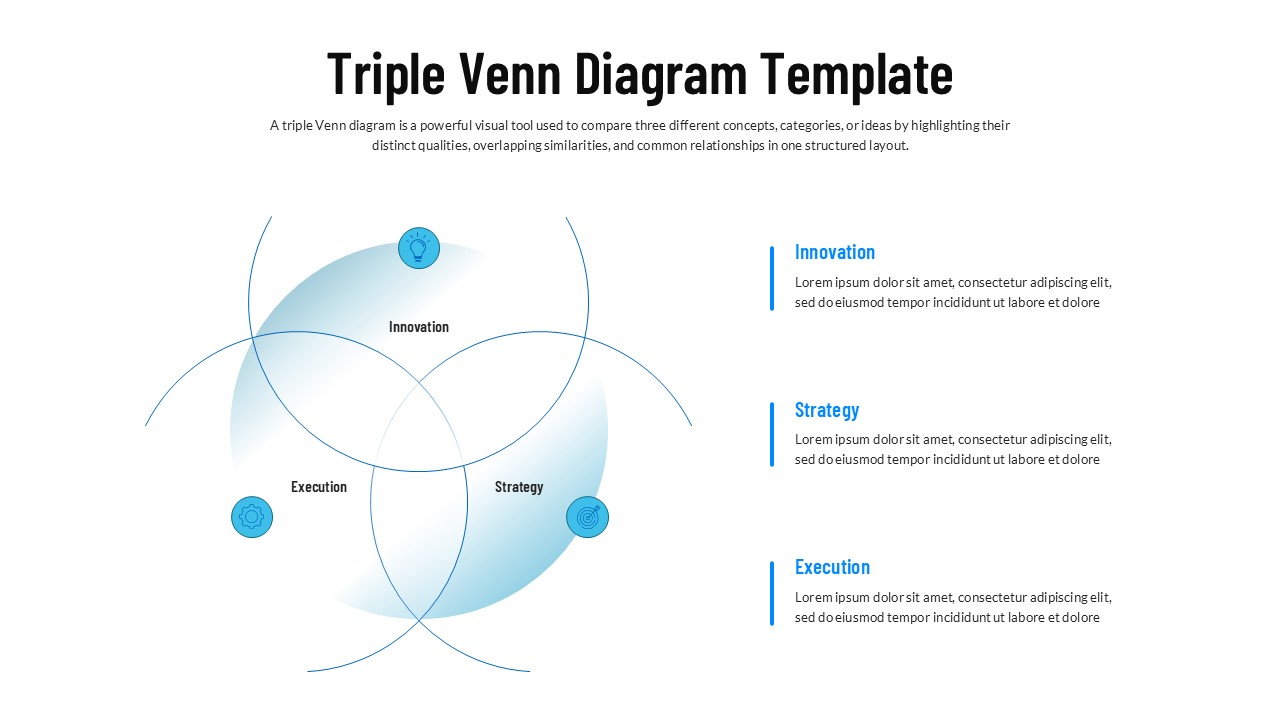
The template features three intersecting circles arranged around a central overlap, complemented by dedicated text sections and modern infographic icons for each category. The layout creates strong visual contrast, helping the comparison stand out during presentations while maintaining a clean and professional appearance. Each element is created using editable PowerPoint shapes, allowing users to customize colors, labels, icons, transparency, and text to match their presentation requirements.
Download the Triple Venn Diagram PowerPoint Template to present strategic frameworks, compare business concepts, visualize collaborative relationships, or simplify analytical discussions using a professional comparison diagram that is both flexible and presentation-ready.
Frequently Asked Questions
How do I create a Triple Venn Diagram in PowerPoint?
You can create a Triple Venn Diagram in PowerPoint by drawing three overlapping circles with PowerPoint shapes and adding text boxes for each section. A faster approach is to use a Triple Venn Diagram PowerPoint Template, which includes pre-designed, fully editable circles, labels, and infographic elements. This allows you to focus on presenting your ideas instead of building the diagram from scratch.
What is a Triple Venn Diagram used for?
A Triple Venn Diagram is used to compare three related concepts, categories, or data sets by showing their unique characteristics and shared relationships. It is commonly used in business presentations, strategic planning, education, marketing analysis, product comparisons, and research to visualize similarities, differences, and overlapping ideas in a single diagram.
Login to download this file
What do you think of this template?
-
Category:
Diagrams -
-

-

Item ID: SPT1053
-

Designed by: Niranjana
-

Color
Related Templates
-
Blank Venn Diagram Template
Diagrams
-
-
5 Way Venn Diagram Template
Diagrams
-

-

-

Free 5 Circle Venn Diagram Template
Diagrams
-

-
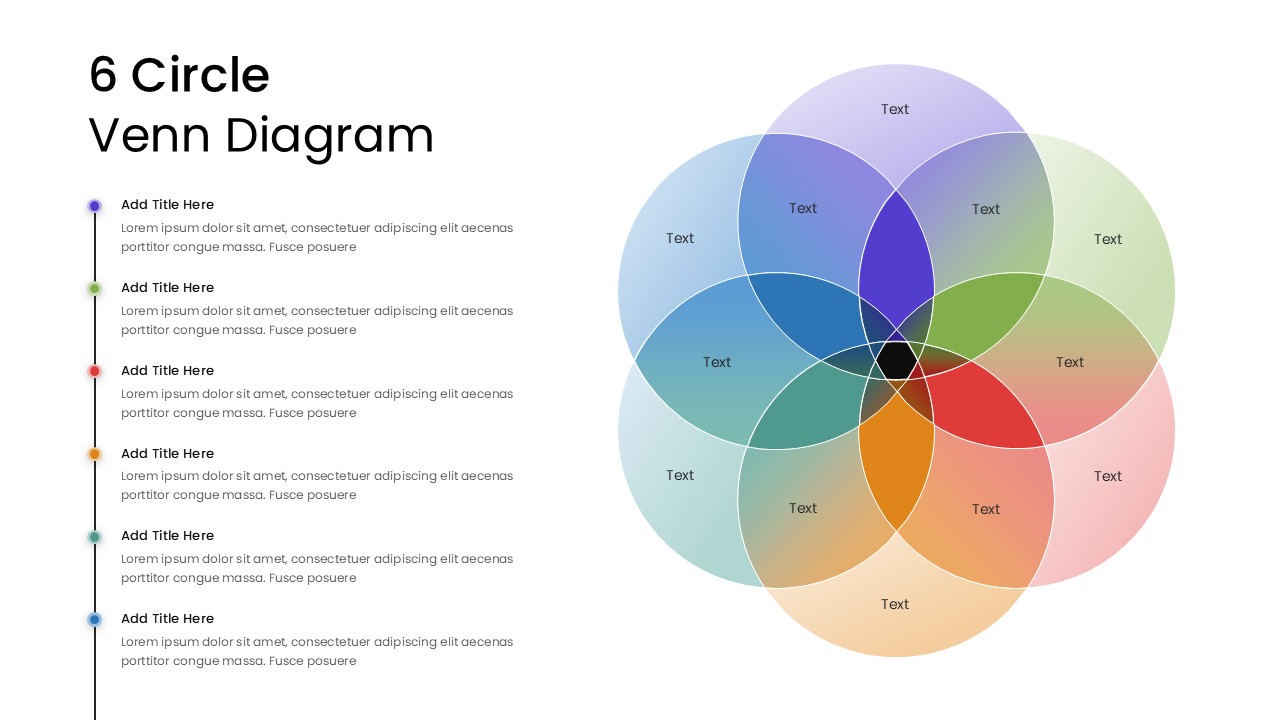
6 Circle Venn Diagram Slides
Business
-

-

-

-