OPEX vs CAPEX Template for Financial Strategy PowerPoint Presentations
Product Description
Few financial concepts create more confusion in boardrooms and budget conversations than the distinction between capital expenditure and operational expenditure, and this OPEX vs CAPEX Template gives finance directors, CFOs, business analysts, IT procurement teams, and management consultants a visually powerful, analytically precise slide that makes that distinction immediately clear to any audience regardless of their financial literacy level.
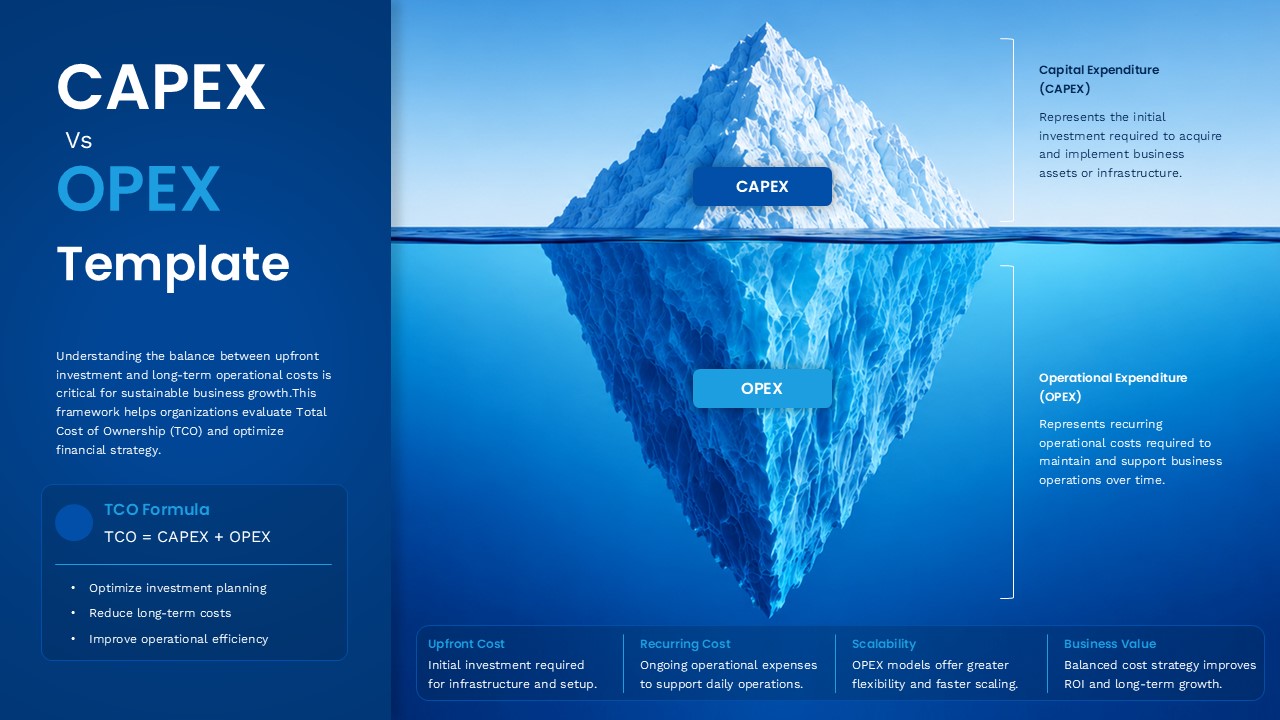
The slide uses an iceberg metaphor rendered with a photorealistic underwater iceberg image to communicate the core insight that CAPEX, the visible portion above the waterline, represents only the initial upfront investment, while OPEX, the vast mass beneath the surface, represents the recurring operational costs that accumulate over time and ultimately determine the true financial weight of any business decision. This single visual metaphor does more explanatory work than three slides of bullet points ever could.
- The CAPEX annotation on the right defines Capital Expenditure as the initial investment required to acquire and implement business assets or infrastructure, framing it as the entry cost that organizations see and plan for upfront.
- The OPEX annotation below the waterline defines Operational Expenditure as the recurring costs required to maintain and support business operations over time, making visible the financial reality that sits beneath every capital investment decision.
- The TCO Formula panel on the left presents the Total Cost of Ownership equation, TCO equals CAPEX plus OPEX, alongside three strategic outcomes: optimize investment planning, reduce long-term costs, and improve operational efficiency, giving finance teams a ready-made framework for the cost strategy conversation.
- The four summary tiles at the bottom of the slide cover Upfront Cost, Recurring Cost, Scalability, and Business Value, each with a one-line definition that gives the audience a complete four-point financial summary without requiring additional slides.
A Capital vs Operational Expenditure Presentation Template
The deep navy blue palette with crisp white typography and the dramatic iceberg centerpiece give this slide a premium, boardroom-grade aesthetic that matches the seriousness of the financial decisions it supports. This CAPEX vs OPEX framework template is fully editable in both Microsoft PowerPoint and Google Slides, so finance teams, consultants, and business analysts can customize the definitions, update the TCO components, and present it on whichever platform their organization or client meeting requires without losing the visual integrity of the iceberg diagram.
Frequently Asked Questions
What is the difference between OPEX and CAPEX and why does it matter for business strategy?
CAPEX refers to Capital Expenditure, the upfront investment a business makes to acquire or improve long-term assets like infrastructure, equipment, or software licenses, while OPEX refers to Operational Expenditure, the ongoing costs required to run and maintain those assets day to day. Understanding the balance between the two is critical for Total Cost of Ownership analysis, budget planning, and making financially sound decisions about whether to buy, build, or subscribe to business capabilities.
Who should use this OPEX vs CAPEX Template?
This template is built for CFOs, finance directors, IT procurement managers, business analysts, management consultants, and strategy teams who need to present cost structure frameworks, investment justification analyses, or financial strategy overviews to executive, board, or client audiences. It works across industries including technology, manufacturing, healthcare, real estate, and professional services where CAPEX and OPEX decisions directly impact balance sheets and long-term financial performance.
Login to download this file
What do you think of this template?
-
Category:
Business -
-

-

Item ID: SPT1039
-

Designed by: Niranjana
-

Color
Related Templates
-
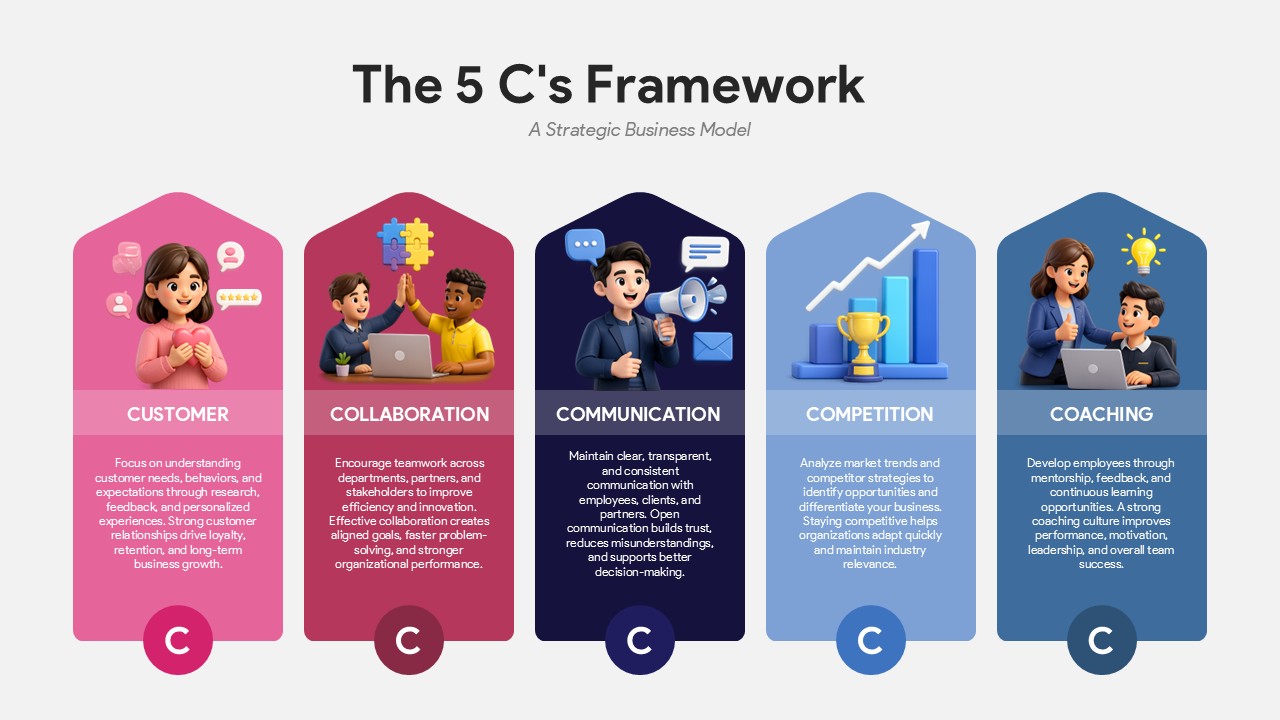
5C’s Framework Model Template For Business Strategy Presentations
Business Strategy
-

-
-

-
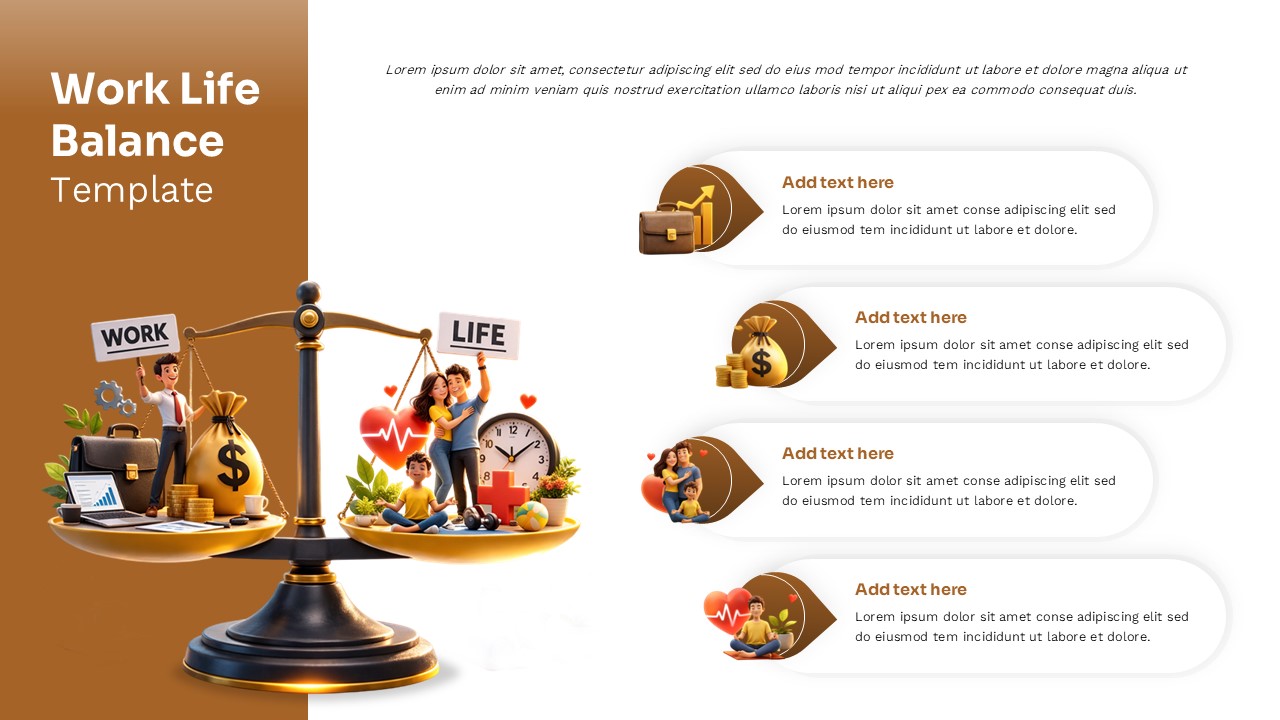
Work Life Balance Presentation Template
Human Resource
-
-
-

-

-

-

-